The healthcare services deal market is bigger than M&A
Announced M&A is the narrowest layer of healthcare services supply. Establishment churn and provider retirement reveal a much larger succession market, and whether that supply becomes durable local capacity depends on who provides the care next.
Announced deals show the visible transaction market. Establishment churn and provider age show the succession market, and the succession market is far larger.
Executive summary
- Announced mergers and acquisitions are the visible tip. Against a base of 198,477 physician offices and 128,007 dentist offices, staffed by 1,032,365 physicians and 202,485 dentists, LevinPro tracks about 2,000 healthcare deals a year and roughly 500 physician medical group (“PMG”) transactions.[1][2][4][7] The real supply of owner-transition events is much larger than either count.
- Site churn dwarfs deal count. The Census Business Dynamics Statistics (“BDS”) recorded 15,249 physician-office and 8,470 dentist-office establishment exits in 2023, about 29 and 34 times the 2025 PMG and dental-PMG deal counts.[1][2] These are churn signals, not confirmed sales, but they mark the size of the hidden layer.
- Supply is really a succession question. Each transition asks two things: who owns the site next, and who provides the care next. In healthcare services the second increasingly decides the first.
- Provider replacement is the binding constraint. Nearly a quarter of active physicians are 65 or older,[4] the procedural specialties that attract roll-ups graduate only a few hundred clinicians a year,[6] and dentists now retire around age 68.7.[7] Capital cannot manufacture clinicians.
- The national pipeline is not the shortage. Gross training completions, about 52,405 residents and fellows a year, run above the roughly 22,700 physicians aging into retirement age each year and the 23,600 replacement openings the Bureau of Labor Statistics projects.[4][6][15][16] Shortages persist because the market does not replace a doctor with a doctor. It replaces a specific specialty, in a specific place, willing to own a practice.
- The dealable universe is broad but not banker-ready. Most exits are too small or too owner-dependent for institutional M&A. The useful question is how much of that churn can be turned into durable local capacity.
- The right test is ownership-neutral. Judge a transaction by what it builds and what it controls, not by the buyer’s label.
The numbers that change the denominator
| Measure | Physician side | Dental side |
|---|---|---|
| Sites (stock) | 198,477 physician offices | 128,007 dentist offices |
| Providers (stock) | 1,032,365 active physicians | 202,485 active dentists |
| Age 65+ (retirement exposure) | 23.9% | 15.5% (average retirement age 68.7) |
| New graduates per year (inflow) | 52,405 residents, all specialties | about 6,872 dental graduates |
| Establishment exits per year (2023 site churn) | 15,249 | 8,470 |
| Announced deals per year | about 500 PMG, all specialties | 248 dental |
Read down the columns and the mismatch is obvious. The deal market bankers watch, about 500 PMG transactions a year, is a rounding error against 198,477 physician offices and 1,032,365 physicians, and it is small even against the 15,249 offices that exited in a single year. Read across the flows and the squeeze is the other story: retirement exposure of 23.9% of physicians and 15.5% of dentists is met by an inflow of 52,405 new residents and about 6,872 dental graduates, and only a fraction of either group will take over a practice rather than take a salaried job.[1][2][4][6][7]
Healthcare services deal flow is usually counted from the top down: how many transactions closed, how many platforms traded, how much sponsor capital was deployed, and which specialties were most active. That view misses the bigger market.
The real supply of healthcare services assets is not only the practices that hired bankers and closed a transaction. It also includes practices quietly listed for sale, groups that would sell if a successor appeared, clinics that merge into a hospital or platform without a clean public deal record, and practices that simply disappear when an owner retires and no buyer shows up.
That matters because healthcare services is not just a financial asset class. It is a local capacity system. Every practice succession asks two questions: who owns the site next, and who provides the care next? The first is an M&A question. The second is a workforce question. In healthcare services, the second one increasingly controls the first.
The visible market is only the surface
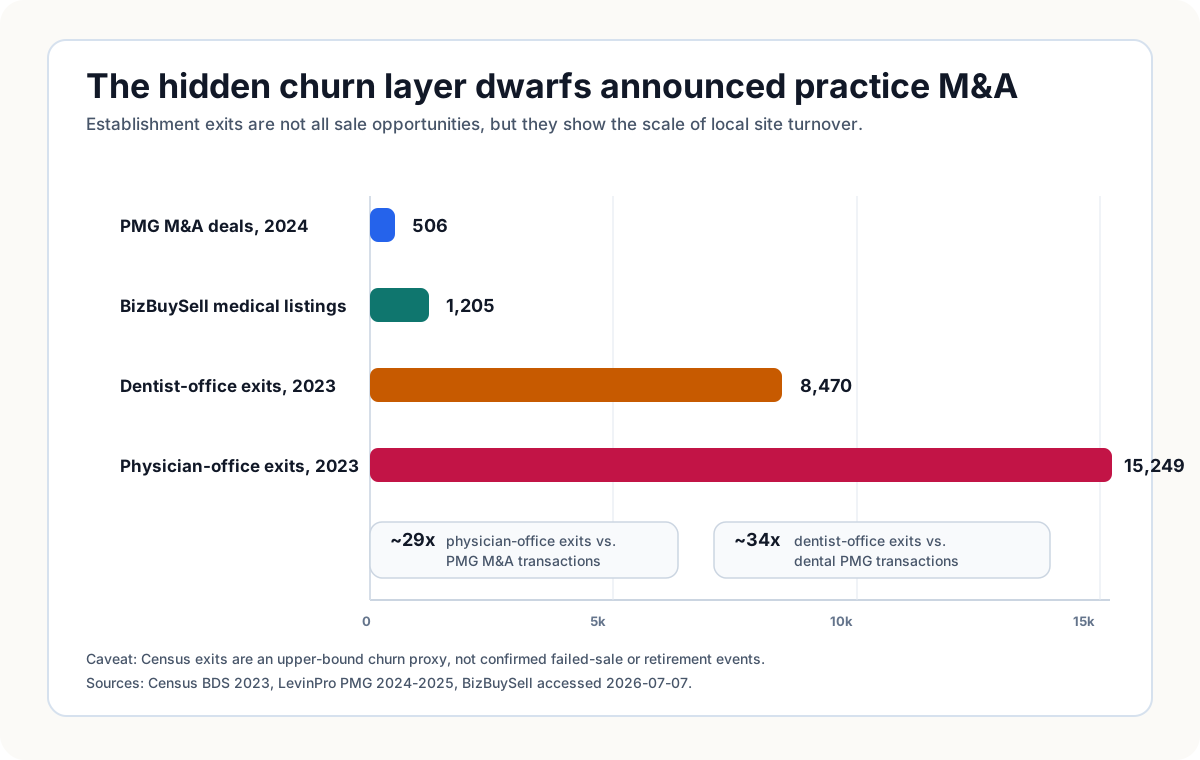
The announced transaction market is meaningful, but it is not the whole supply pool. LevinPro reported about 2,000 announced healthcare M&A transactions a year in 2024 and 2025, depending on vendor cutoff timing. PMG deal volume was roughly 500 transactions a year: 506 in 2024 and 521 in 2025.[2]
That is the market sponsors, bankers, and strategy teams are used to seeing. Within it, the current PMG mix skews heavily toward dental and selected outpatient specialties. LevinPro’s 2025 PMG count included 248 dental deals, 34 eye-care deals, 32 dermatology deals, and 31 orthopaedic deals.[2]
Now compare that visible flow with the broader churn pool.
| Layer of supply | What it captures | Current read |
|---|---|---|
| Announced healthcare M&A | Publicly tracked healthcare transactions | About 2,000 deals per year |
| Announced PMG M&A | Physician medical group transactions | About 500 deals per year |
| Visible small-practice listings | Practices actively advertised for sale | 1,205 medical-practice and 198 dental-practice listings on BizBuySell, checked July 7, 2026 |
| Physician-office establishment exits | Sites disappearing, merging, closing, or otherwise exiting | 15,249 exits in 2023 Census BDS |
| Dentist-office establishment exits | Dental sites disappearing, merging, closing, or otherwise exiting | 8,470 exits in 2023 Census BDS |
The comparison is not apples to apples. A Census establishment exit is not necessarily a failed practice sale. It can be a closure, relocation, consolidation, firm death, entity cleanup, or merger into another operating structure. It is still the best public signal of the hidden churn layer.[1][3]
And that layer is large. Physician-office exits in the 2023 Census BDS were about 29 times the 2025 PMG deal count, comparing 15,249 exits to 521 transactions. Dentist-office exits were about 34 times the 2025 dental PMG deal count, comparing 8,470 exits to 248 transactions.[1][2] One caveat travels with those multiples: physician-office exits exclude dentist offices, while the 521 PMG total includes the 248 dental deals, so read the ratios as order-of-magnitude signals rather than clean conversions. In stock terms the gap is just as stark: a single year of announced PMG deals equals about 0.25% of the 198,477 physician-office establishments, and even the 1,205 visible listings are only about 0.6%.[1][2][3]
The takeaway is not that every closing clinic was a missed acquisition. It is that the supply of potential owner-transition events is much larger than the institutional M&A market can see or absorb.
The denominator problem cuts both ways
This is the same denominator problem that shows up in private-equity penetration. At the national physician level, PE still looks modest. The American Medical Association (“AMA”) 2024 benchmark found that 6.5% of physicians worked in PE-owned practices, while 42.2% were in private practice, 34.5% worked in hospital-owned practices, and 57.5% were employees rather than owners.[8]
That national view is useful, but it hides local control. A specialty can look barely touched nationally and still be heavily consolidated in a specific metro or referral market. The healthcare services landscape article made this point with specialty-specific PE data: all-physician penetration is one denominator, and dermatology, gastroenterology, urology, ophthalmology, anesthesia, emergency medicine, dental, and cardiology each need their own.[8]
Deal supply looks the same way once you set a specialty practice base next to its deal count. In the three specialties with a clean practice-base estimate, announced deals run near 1% of the practice base a year.
| Specialty | Group practices (est.) | 2025 deals | Deals as share of practice base |
|---|---|---|---|
| Dermatology | 3,000+ | 32 | ~1% |
| Eye care / ophthalmology | 3,700+ | 34 | ~0.9% |
| Orthopaedics | 5,829 (2020) | 31 | ~0.5% |
These counts come from commercial and peer-reviewed databases rather than an official census, and a group practice can run several sites, so treat them as directional.[12][13][14] The sharper consolidation signal is not the deal count anyway. It is the disappearance of small independent practices underneath it: orthopaedic practices fell about 20% from 2012 to 2020 even as surgeon counts stayed flat.[14]
The same logic applies to deal supply. There is no single “healthcare services deals available” number. A serious supply map has to ask several questions at once.
| Denominator | What it tells you | What it misses |
|---|---|---|
| Closed M&A deals | What institutional buyers already reached | Quiet sales, failed sales, non-bankered succession |
| Active listings | Seller intent at a point in time | Stale listings, duplicates, listings outside broker marketplaces |
| Establishment exits | Site churn and disappearance | Whether a sale was attempted, why a site closed |
| Provider age | Succession pressure | Whether a provider owns a practice or wants to sell |
| Graduate flow | Replacement capacity | Geographic distribution, specialty fit, willingness to own |
The practical market is the overlap: older owner-operators, in fragmented settings, with enough clinical capacity, payer access, and operating quality to become a viable successor transaction. That is smaller than Census churn and larger than announced M&A.
Healthcare services is a succession market
The private-equity debate often starts with capital: who has it, who deploys it, who extracts it, and who controls the economics after the deal. That is necessary but incomplete. The more basic question is succession.
Many local healthcare businesses were built around a provider-owner who holds the patient relationships, referral trust, clinical standards, payer history, staff culture, and building-level know-how. If that owner retires into a prepared successor, the community may keep the same access point. If the owner sells to a strong operator, the site may continue and modernize. If no successor exists, the site may close, shrink, or get absorbed.
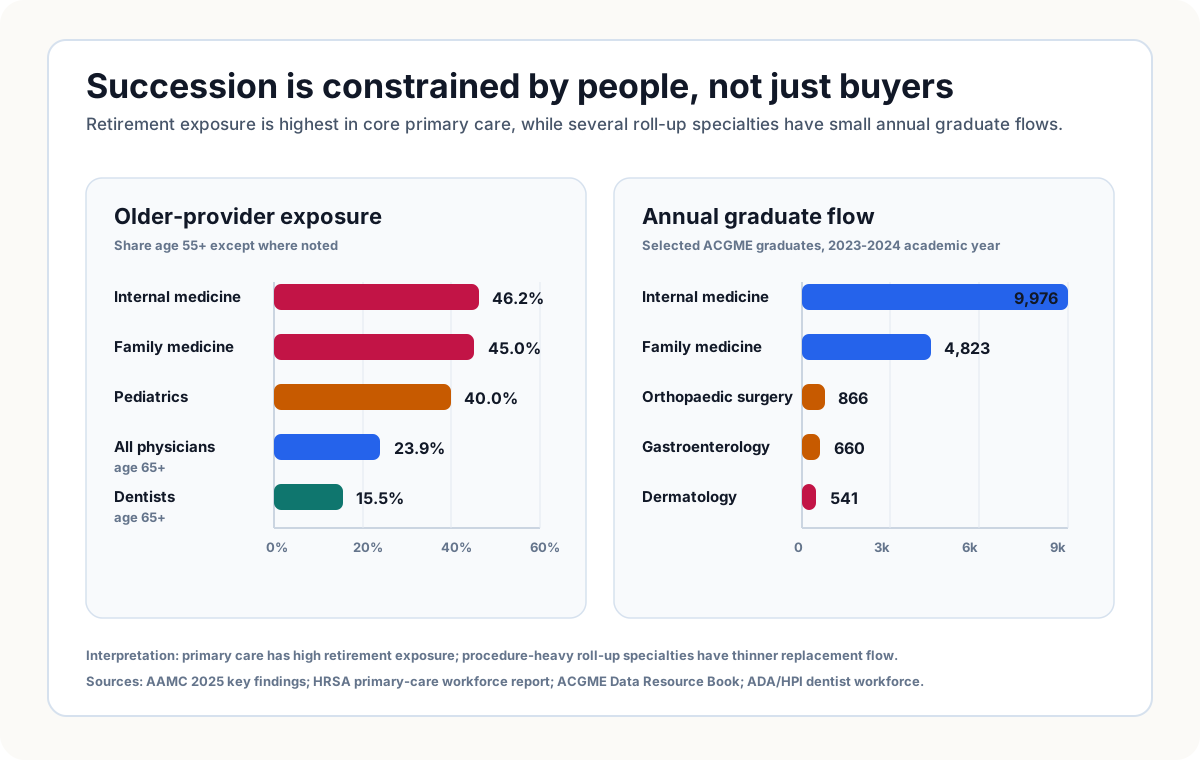
The provider age data make this concrete. The Association of American Medical Colleges (“AAMC”) counted 1,032,365 active physicians in 2024, and 23.9% were age 65 or older against 16.9% under 40.[4] The Health Resources and Services Administration (“HRSA”) shows even sharper exposure in primary care, and the American Dental Association Health Policy Institute (“ADA/HPI”) gives the cleanest dental read.
| Provider group | Replacement pressure signal |
|---|---|
| All active physicians | 1,032,365 active in 2024 (AAMC); 23.9% age 65+, 16.9% under 40[4] |
| Family medicine | 124,049 active in 2023 (HRSA); 45.0% age 55+[5] |
| Internal medicine | 130,483 active in 2023 (HRSA); 46.2% age 55+[5] |
| Pediatrics | 79,356 active in 2023 (HRSA); 40.0% age 55+[5] |
| Dentistry | 202,485 professionally active in 2024 (ADA/HPI); 15.5% age 65+, average retirement age 68.7[7] |
Graduate flow helps, but it does not solve the ownership problem by itself. The Accreditation Council for Graduate Medical Education (“ACGME”) counted 52,405 graduating residents in the 2023-2024 academic year, with the largest flows in internal medicine, family medicine, pediatrics, and emergency medicine. The smaller procedural specialties that attract roll-up interest have much thinner annual replacement: 660 gastroenterology graduates, 541 dermatology graduates, 512 ophthalmology graduates, 358 urology graduates, and 866 orthopaedic surgery graduates in the same year.[6]
Those 52,405 completions also settle a question worth naming: is the pipeline actually smaller than retirement? Nationally, no. The gross flow of 52,405 residents and fellows finishing training, a figure that includes fellows and is not a clean count of new independent physicians, runs well above a directional run-rate of roughly 22,700 physicians aging into retirement age each year and the 23,600 replacement openings the Bureau of Labor Statistics (“BLS”) projects annually.[4][15][16] So aggregate inflow exceeds retirement-age inflow. The catch is that the physician market does not clear as one national pool. It clears by specialty, geography, payer network, clinical hours, and practice ownership. A new hospitalist in a well-supplied metro does not replace a retiring rural family-medicine owner, and a fellowship completion in one specialty adds no capacity in another. Even in primary care, where graduate flow runs above the aging-into-65 run-rate, about 1.7 times in family medicine and 3.2 times in internal medicine, most new physicians take salaried roles rather than buy a retiring owner’s practice.[5][6] That is the succession gap the national headcount hides.
That changes how to read consolidation. A sponsor can buy a dermatology group, a GI practice, a urology group, an ophthalmology practice, or a dental platform, but the underwriting does not end at the acquisition. It depends on retaining and recruiting scarce clinicians, preserving referrals, and replacing retiring owners without turning the practice into a staffing problem.
Private equity follows the available succession paths
The healthcare services landscape article described PE as following “roll-up physics”: fragmented local ownership, recurring or procedural revenue, referral leverage, standardized workflows, centralizable revenue cycle, and a structure where a management services organization (“MSO”), a dental support organization (“DSO”), a staffing company, or a management company can control the non-clinical economics.[8]
The deal-supply research adds another rule: PE follows succession paths that can be converted into repeatable add-ons.
That explains why dental and outpatient procedural categories keep showing up. They have owner-operator fragmentation, visible clinical sites, repeatable operating playbooks, referral or patient-flow channels, and enough margin to pay a control premium. They also have a steady stream of owner-transition pressure.
The 2026 healthcare PE white paper from McGuireWoods makes the same point from the investor side. It frames healthcare PE as a maturing but still fragmented market, with record 2025 deal value, more than 100 PE-backed DSOs, continued dental fragmentation, specialty-specific physician practice management activity, outpatient migration into ambulatory surgery centers (“ASCs”) and office-based settings, reimbursement pressure, and revenue cycle management (“RCM”) automation as a value-creation lever.[11]
The investor version of the story is “consolidation runway.” The community version is “succession gap.” Both describe the same terrain from opposite ends.
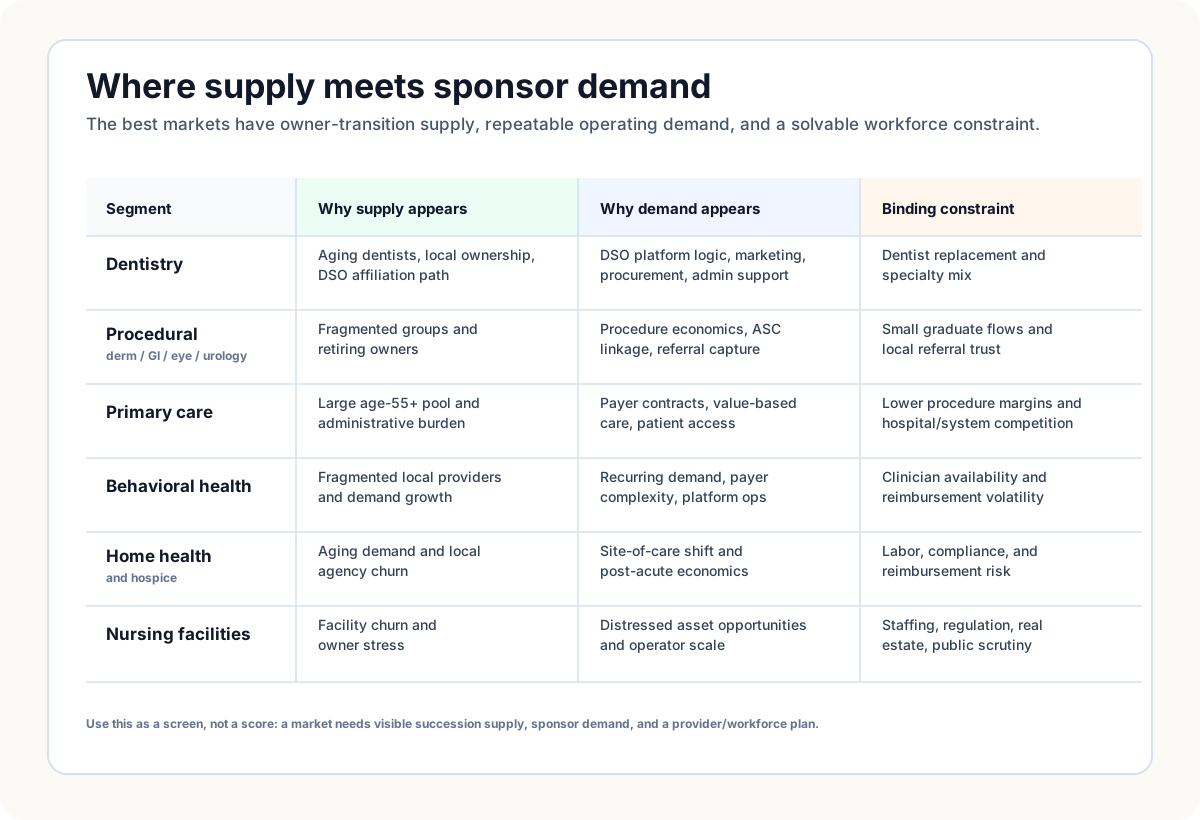
| Segment | Why supply appears | Why demand appears | Constraint |
|---|---|---|---|
| Dentistry | Aging dentists, local practice ownership, DSO affiliation path | DSO platform logic, procurement, staffing, marketing, payer and admin support | Dentist replacement and specialty mix |
| Dermatology, GI, ophthalmology, urology | Fragmented groups and retiring owners | Procedure economics, ASC linkage, referral capture | Small graduate flows and local referral trust |
| Primary care | Large age-55+ pool and administrative burden | Payer contracts, value-based care, patient access | Lower procedure margins and hospital or system competition |
| Behavioral health | Fragmented local providers and demand growth | Recurring demand, payer complexity, platform operations | Clinician availability and reimbursement volatility |
| Home health and hospice | Aging demand, local agency churn | Site-of-care shift and Medicare and post-acute economics | Labor, compliance, and reimbursement risk |
| Nursing facilities | Facility churn and owner stress | Distressed asset opportunities, operator scale | Staffing, regulation, real estate, and public scrutiny |
The best targets are not just available. They are available, clinically replaceable, operationally standardizable, and defensible enough to survive the sponsor’s hold period.
The AI channel changes demand, not just operations
The private-equity AI-channel article argued that PE has committed to AI faster than it can deploy it. Sponsors want AI in diligence, underwriting, value creation, and portfolio operations, but many portfolio companies still lack a production use case. That creates a channel for AI-native deployment partners: the sponsor, not just the individual portfolio company, becomes the route to market.[10]
In healthcare services, that matters because the market outside sponsor portfolios is much larger than the market already owned by sponsors. If only 6.5% of physicians are in PE-owned practices, the bigger opportunity is not selling software to existing PE-backed groups. It is helping sponsors evaluate, integrate, and operate the independent and semi-independent practices they are trying to buy next.[10]
The supply problem becomes an AI deployment problem in four places.
| Workflow | Why it matters |
|---|---|
| Target discovery | Identify owner-transition candidates before they become bankered processes |
| Diligence | Read provider age, referral dependency, payer exposure, site churn, clinical capacity, and compliance risk quickly |
| Integration | Move small practices onto a common RCM, staffing, procurement, analytics, and reporting backbone without breaking local workflows |
| Succession planning | Match retiring-owner risk with recruiting, associate buy-in, clinical governance, and de novo or site-development plans |
This is where the AI-channel argument and the deal-supply argument meet. AI is not only a cost-takeout tool after a sponsor owns a platform. It can become part of how sponsors see the off-market succession pool, underwrite provider replacement, and decide which local assets can become durable capacity rather than fragile roll-up inventory.
That cuts both ways. Better data can help identify practices that need succession capital. It can also accelerate consolidation in markets where the main protection against roll-up was opacity and local fragmentation.
The ownership-neutral test
The earlier healthcare PE article argued that the debate should move past “PE good” or “PE bad” toward a practical test: what does the transaction build, and what does it control? Useful capital builds capacity, reduces administrative burden, improves operations, and leaves the asset stronger. Bad control extracts economics, concentrates market power, thins staffing, and leaves the next owner or community with the problem.[9]
The deal-supply research sharpens that test. Judge a buyer not only by what it pays for an asset, but by what happens to local capacity after the owner exits.
| Question | Good answer | Bad answer |
|---|---|---|
| What succession problem is being solved? | Retiring owner, undercapitalized group, access-constrained site, or administrative overload | Sponsor needs add-on volume to support a platform multiple |
| What provider capacity is preserved or added? | Clinician retention, associate path, recruiting plan, an advanced practice provider (“APP”) and nurse model, de novo access | Productivity lift without credible replacement capacity |
| What control is changing? | Transparent MSO or DSO or management rights with clinical governance | Economics move above the license while accountability stays local |
| What happens if the deal fails? | Site remains viable, records and patients transition cleanly, community has alternatives | Closure, service-line cut, distressed exit, or payer and referral disruption |
| What is the exit thesis? | Asset can stand as a stronger operator | Another financial buyer must pay more before operational risk appears |
This frame is ownership-neutral. Hospitals, insurers, corporate chains, nonprofits, public companies, and PE sponsors can all preserve or destroy local capacity. PE earns extra scrutiny because leverage, finite hold periods, management fees, sale-leasebacks, and sponsor-control rights can widen the gap between ownership and accountability. But the policy problem is broader than PE.
Healthcare services needs capital. It also needs replacement clinicians, durable access points, visible ownership, and rules that keep control attached to responsibility.
The real market map
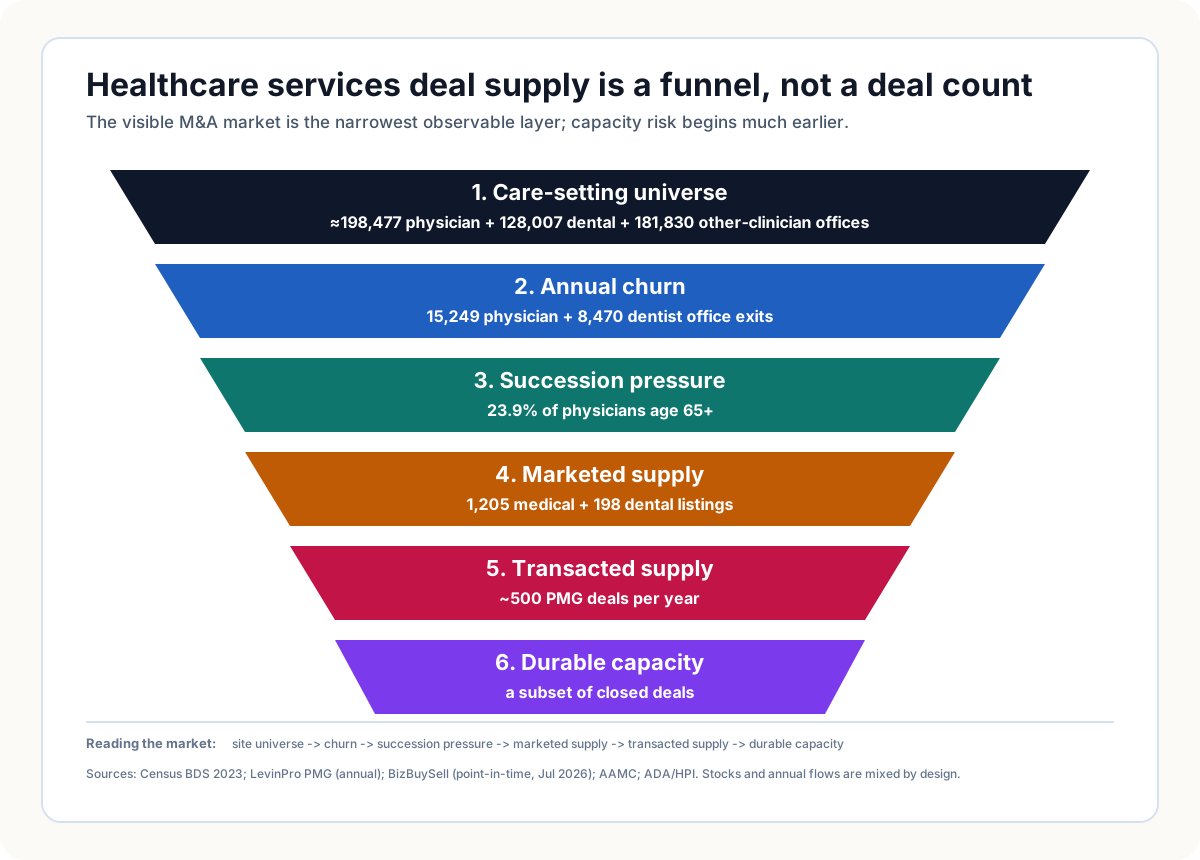
The practical map of healthcare services supply is a funnel.
- Total care-setting universe: physician offices, dental offices, ASCs, behavioral health sites, home health agencies, hospice providers, nursing facilities, and ancillary assets.
- Annual churn: establishments entering, exiting, merging, relocating, or disappearing.
- Succession pressure: owners nearing retirement, practices too small to recruit successors, and clinicians leaving ownership for employment.
- Marketed supply: listings, brokered processes, proprietary outreach, and local succession conversations.
- Transacted supply: deals that close, from local owner-to-owner sales to platform add-ons and recapitalizations.
- Durable capacity: the smaller subset of deals that leave the care site and provider base stronger after transition.
Most market maps stop at step five. Healthcare policy should care about step six.
That is the important distinction. A practice sale can be a capacity-preserving succession plan. It can also be the first step in financial engineering that weakens the site. A closure can be an ordinary business event. It can also be a community access failure caused by the absence of a buyer, a successor, or a workforce pipeline.
So the question for healthcare services investors is not simply “how many deals are available?” The better question is how many local care assets can be transitioned into stronger operating homes before owner retirement turns into capacity loss.
That is the supply side of healthcare consolidation. It is larger, messier, and more important than announced M&A.
Sources
[1] U.S. Census Bureau, Business Dynamics Statistics 2023, 4-digit NAICS establishment and exit data: https://www.census.gov/data/datasets/time-series/econ/bds/bds-datasets.html
[2] Irving Levin Associates / LevinPro HC, healthcare and physician medical group deal data, 2024-2025 (including “Most Active PMG Buyers of 2025,” Jan. 2026): https://www.levinassociates.com/most-active-pmg-buyers-of-2025/
[3] BizBuySell, “Medical Practices For Sale” and “Dental Practices For Sale,” accessed July 7, 2026: https://www.bizbuysell.com/medical-practices-for-sale/
[4] AAMC, “2025 Key Findings,” U.S. Physician Workforce Data Dashboard: https://www.aamc.org/data-reports/data/2025-key-findings
[5] HRSA National Center for Health Workforce Analysis, “State of the Primary Care Workforce, 2025”: https://bhw.hrsa.gov/sites/default/files/bureau-health-workforce/data-research/State-of-the-Primary-Care-Workforce-2025.pdf
[6] ACGME, “Data Resource Book, Academic Year 2024-2025,” Table D.5: https://www.acgme.org/globalassets/pfassets/publicationsbooks/2024-2025_acgme_databook_document.pdf
[7] ADA Health Policy Institute, “The U.S. Dentist Workforce,” 2024-2025 data: https://www.ada.org/resources/research/health-policy-institute/dentist-workforce
[8] Next Kin Partner, “U.S. healthcare services landscape, ownership and control structure,” July 2, 2026: https://nkpartner.com/insights/us-healthcare-services-market-landscape-control
[9] Next Kin Partner, “Private equity in healthcare is more than a morality debate,” July 6, 2026: https://nkpartner.com/insights/private-equity-healthcare-morality-debate
[10] Next Kin Partner, “Private equity’s AI underwriting and deployment gap,” July 3, 2026: https://nkpartner.com/insights/private-equity-ai-channel
[11] McGuireWoods LLP, “Private Equity in Healthcare and Life Sciences: An Updated Review of Select Subsector Investment Areas,” 2026 White Paper.
[12] Definitive Healthcare, “Largest Dermatology Physician Group Practices in the U.S.” (3,000+ active group practices), accessed July 9, 2026: https://www.definitivehc.com/resources/healthcare-insights/largest-dermatology-physician-groups
[13] Definitive Healthcare, “Top Ophthalmology Physician Group Practices in the U.S.” (3,700+ active group practices), accessed July 9, 2026: https://www.definitivehc.com/resources/healthcare-insights/largest-ophthalmology-physician-groups
[14] Pollock et al., “Orthopaedic Group Practice Size Is Increasing,” Arthroscopy, Sports Medicine, and Rehabilitation, 2021, using the Physician Compare database (5,829 practices in 2020, down from 7,299 in 2012): https://pmc.ncbi.nlm.nih.gov/articles/PMC8689279/
[15] AAMC, “New AAMC Report Shows Continuing Projected Physician Shortage,” March 21, 2023 (physicians age 55-64 about 22% and age 65+ about 20% of the clinical physician workforce): https://www.aamc.org/news/press-releases/new-aamc-report-shows-continuing-projected-physician-shortage
[16] U.S. Bureau of Labor Statistics, Occupational Outlook Handbook, “Physicians and Surgeons,” 2024-2034 projections (about 23,600 openings per year): https://www.bls.gov/ooh/healthcare/physicians-and-surgeons.htm