U.S. healthcare services landscape, ownership and control structure
A working map of U.S. healthcare services by care setting, specialty, workforce, and ownership control layer, with a read on how far private equity has actually gotten.
Grab one headline number and stop, and you will misread U.S. healthcare services. In 2024, national health expenditures hit $5.3 trillion, or $15,474 per person; hospital care alone was $1.63 trillion and physician and clinical services $1.11 trillion.[1] Those figures show where the money goes. They stay silent on who controls a site, who employs the clinician, where referrals flow, or whether a local owner-operator faces a health system, a corporate chain, a DSO, an MSO, or a private-equity platform. Ownership and control decide how the market consolidates. Spending only sizes it.
A more useful map has three layers:
| Layer | Question | Why it matters |
|---|---|---|
| Care setting | Where does the encounter happen? | Determines capital intensity, patient flow, licensing, and reimbursement mechanics |
| Specialty / service line | What work is being done? | Determines margin structure, referral leverage, procedure intensity, and staffing model |
| Ownership / control | Who owns the economics? | Determines consolidation path, operating playbook, and private-equity relevance |
That third layer trips up analysts. A clinic can be clinically independent and still run day to day by an MSO. A dentist can own the professional entity while a DSO runs staffing, procurement, real estate, marketing, billing, and growth capital. A physician can be employed by a hospital, work in a hospital-owned practice, stay in a small physician-owned group, or sit inside a PE-backed platform.
The market at a glance
| Setting or segment | Scale marker | Ownership/control signal | PE penetration read |
|---|---|---|---|
| National health expenditures | $5.3T in 2024 | Spending pool, not ownership map | Not useful as a PE denominator |
| Hospital care | $1.63T in 2024 | Nonprofit, government, and for-profit systems dominate | Low by facility count; relevant in distressed assets and outsourced staffing |
| Physician and clinical services | $1.11T in 2024 | Independent groups, small groups, health systems, large groups, MSOs | Moderate overall; high in selected procedural specialties |
| U.S. hospitals | 6,100 hospitals; 907,216 staffed beds | 5,121 community hospitals; 3,567 community hospitals in systems | Lower than outpatient roll-up markets |
| HRSA-funded health centers | 32.4M patients; >16,200 sites | Community/safety-net model | Low PE relevance |
| Medicare-certified ASCs | 6,308 in 2023 | Physician ownership, hospital JVs, ASC managers, specialty platforms | Moderate to high in GI, ophthalmology, orthopedics, pain |
| Behavioral health facilities | 20,681 eligible SUD/mental-health facilities in 2023 | Local practices, nonprofits, platforms | Moderate to high in autism/ABA, SUD, IOP/PHP, outpatient platforms |
| Nursing facilities | 14,742 CMS-certified facilities in July 2025 | For-profit operators are material; ownership can be layered | Moderate, but hard to see through OpCo/PropCo structures |
| Hospice | ~6,700 providers in 2024 | For-profit provider growth is a major market feature | Moderate to high in for-profit platforms |
| Dialysis | ~7,600 outpatient facilities in 2024 | Public-chain concentration matters more than PE | Low PE read; high corporate concentration |
Sources: CMS, AHA, HRSA, MedPAC, KFF, SAMHSA.[1][2][3][7][8][9][10][11][12]
A visual map
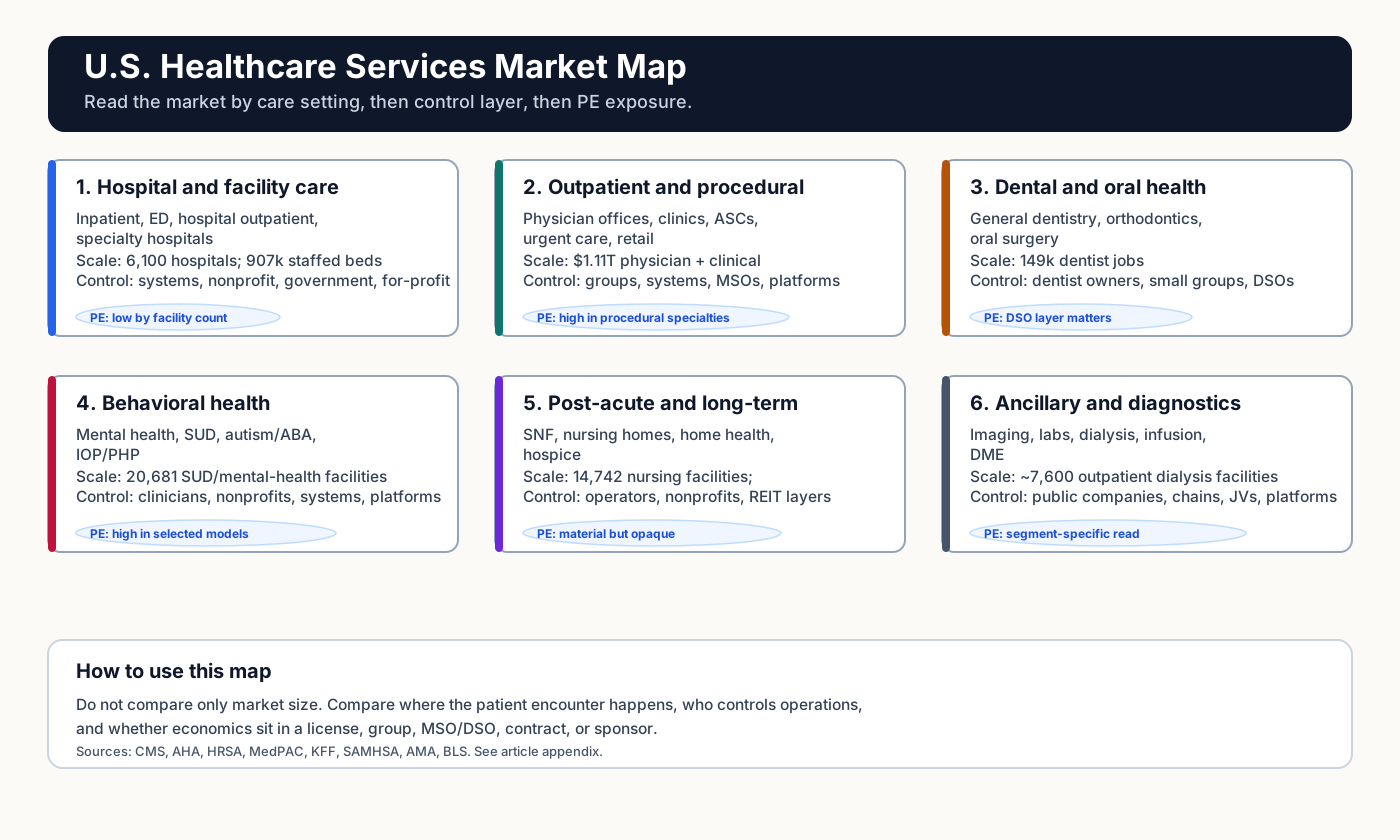
The map splits the market into six operating arenas:
| Arena | Core settings | Control layer to watch |
|---|---|---|
| Hospital and facility-based care | Inpatient, ED, hospital outpatient, specialty hospital | Health systems, public/nonprofit owners, for-profit hospital operators, outsourced staffing vendors |
| Ambulatory outpatient care | Physician offices, clinics, urgent care, retail, ASCs | Independent groups, health-system groups, MSOs, corporate platforms, specialty roll-ups |
| Dental and oral health | General dental, orthodontics, oral surgery, pediatric dental | Dentist owners, small groups, DSOs, PE-backed DSOs |
| Behavioral health | Therapy, psychiatry, SUD, autism/ABA, IOP/PHP, residential | Local clinicians, nonprofit providers, health systems, national PE-backed platforms |
| Post-acute and long-term care | SNF, nursing home, home health, hospice, personal care | For-profit operators, nonprofits, REIT/PropCo structures, PE-backed platforms |
| Ancillary and diagnostics | Imaging, labs, dialysis, infusion, DME | Public companies, health systems, national chains, physician JVs, PE platforms |
The arena view still flatters facility ownership. A control map does better. It follows the chain from patient encounter to clinician, licensed site, professional entity, management company, payer and referral contracts, and capital sponsor. In outpatient healthcare especially, the party that holds the license is frequently a different party from the one that holds the economics. The section below works through why.
The workforce layer
Healthcare services is also a labor market. BLS counted roughly 3.39 million registered nurse jobs, 382,700 APRN jobs, 162,700 physician assistant jobs, 839,000 physician and surgeon jobs, and 149,300 dentist jobs in 2024.[4] USAFacts, summarizing BLS data, counts about 4.3 million employed nurses under a definition that includes registered nurses, licensed practical and vocational nurses, nurse practitioners, nurse anesthetists, and nurse midwives.[5]
| Workforce group | 2024 jobs / employment marker | Strategic read |
|---|---|---|
| Registered nurses | 3,391,000 jobs | The operating backbone of hospitals, nursing facilities, home health, hospice, behavioral health, and procedural sites |
| APRNs | 382,700 jobs | Physician extender and primary-care/specialty-access lever |
| Physician assistants | 162,700 jobs | Clinic, surgical, specialty, and urgent-care leverage |
| Physicians and surgeons | 839,000 jobs | Professional control and referral architecture |
| Dentists | 149,300 jobs | Separate professional market with DSO control layer |
| All nurses, broad definition | ~4.3M employed | The biggest provider workforce constraint in the map |
Ownership analysis therefore cannot stop at facility count. The same sponsor carries very different operating risk in a nurse-heavy nursing facility, a physician-heavy specialty group, and a dentist-led DSO.
Ownership is the market structure
For all-physician ownership, the AMA’s 2024 benchmark is the best single baseline. It shows how fast the denominator problem shows up: 42.2% of physicians were in private practice, 57.5% were employees, 47.4% worked in practices of 10 or fewer physicians, 34.5% worked in hospital-owned practices, 12.2% were direct hospital employees or contractors, and 6.5% worked in PE-owned practices.[6] For scale, AAMC’s 2025 key findings report 1,032,365 active U.S. physicians in 2024, of whom 866,460 were direct patient-care physicians.[15]
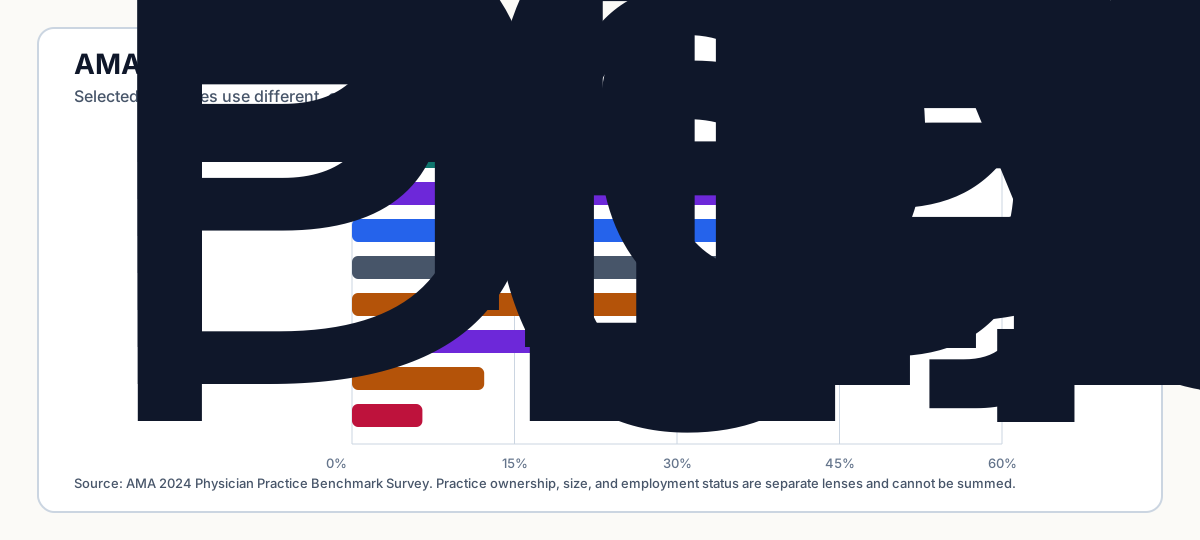
Keep those numbers apart. Collapsing them into one “independent vs. corporate” split hides what each one measures:
| Question | Example denominator | Why it changes the answer |
|---|---|---|
| Is the clinician employed? | Physicians by employment status | Employment can be by a physician group, hospital, corporate group, or platform |
| Who owns the practice? | Physicians by practice ownership | Hospital/system ownership and physician ownership are distinct from employment |
| How big is the group? | Physicians by practice size | Small practices can be owner-operated, affiliated, or managed |
| Who controls operations? | Practice/MSO/DSO/platform relationship | Control may sit above the professional entity |
| Who is the capital sponsor? | Platform sponsor or acquisition history | PE can own the MSO while licenses remain locally held |
Dental carries the same issue. DSO affiliation is a control model. PE is a capital sponsor. A dentist can be DSO-affiliated with no public facility record saying “private equity owned,” and a DSO can be PE-backed with only some of its professional corporations showing PE ownership.[13][14]
Dentistry has its own control layer
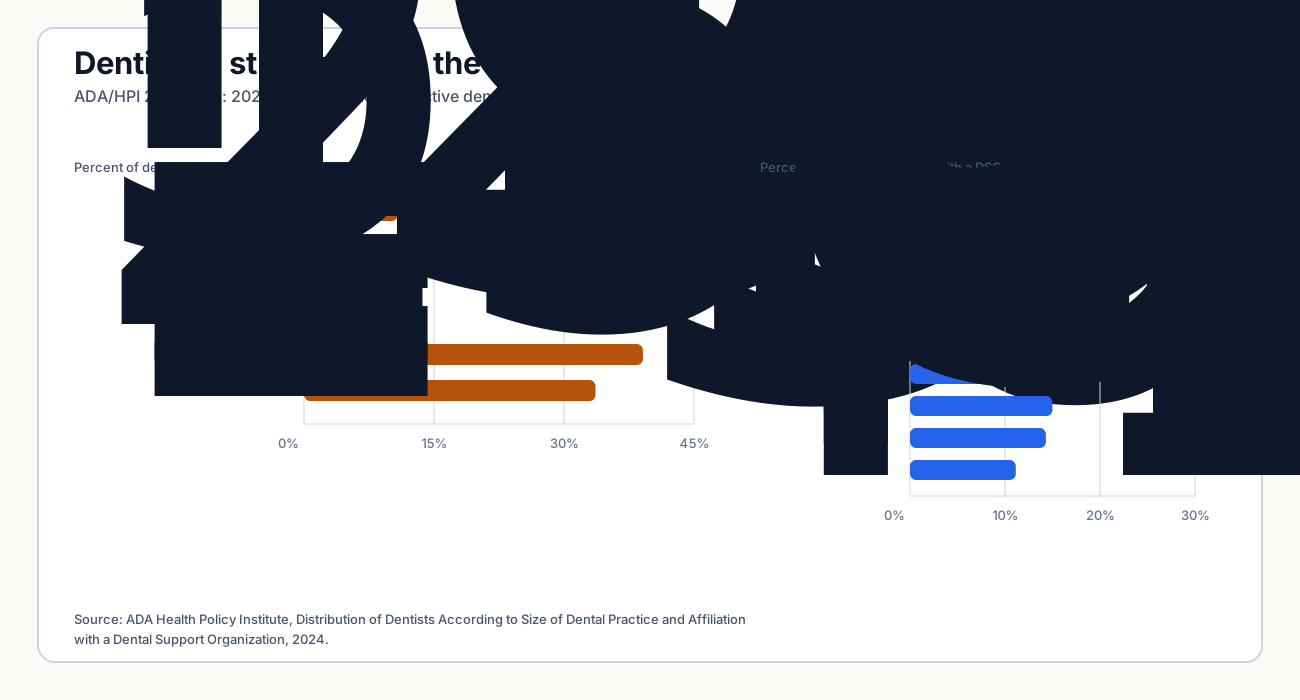
Dentistry needs its own denominator. The workforce, ownership model, and DSO structure differ from physician practices. ADA/HPI counts 202,485 professionally active dentists in 2024.[21] Its 2024 practice-modality workbook covers 198,117 dentists and shows dental practice remains predominantly local, though not purely solo: 33.6% of dentists are affiliated with one-location solo practices, 39.1% with one-location multi-dentist practices, and 16.1% are affiliated with a DSO.[20]
The DSO layer weighs more heavily for younger dentists and certain specialties. Among dentists up to 10 years out of dental school, 26.5% are DSO-affiliated, as are 22.8% of orthodontists, 21.8% of oral and maxillofacial surgeons, and 20.8% of endodontists in the ADA/HPI 2024 modality data.[20]
| Dental segment | Dentist denominator | Practice / DSO signal | Ownership read |
|---|---|---|---|
| All dentistry | 202,485 professionally active dentists in 2024 | 16.1% DSO-affiliated in modality database | DSO is a control layer; PE may sit above the DSO |
| General practice | 159,562 dentists in 2024 | 15.5% DSO-affiliated | Largest dental workforce pool; still heavily local |
| Orthodontics | 10,830 dentists in 2024 | 22.8% DSO-affiliated | High DSO exposure among major dental specialties |
| Pediatric dentistry | 9,312 dentists in 2024 | 15.0% DSO-affiliated | Specialty platform interest, but below ortho/OMS/endo |
| Oral and maxillofacial surgery | 7,424 dentists in 2024 | 21.8% DSO-affiliated | Specialist economics and referral flows matter |
| Endodontics | 5,685 dentists in 2024 | 20.8% DSO-affiliated | Specialty DSO/platform logic is meaningful |
Private equity follows roll-up physics
Private equity penetrates healthcare services unevenly. It follows a specific pattern: fragmented local ownership, recurring or procedural revenue, referral leakage that can be managed, standardized workflows, centralized revenue cycle, and a professional-services structure where an MSO, DSO, or management company can control non-clinical economics.
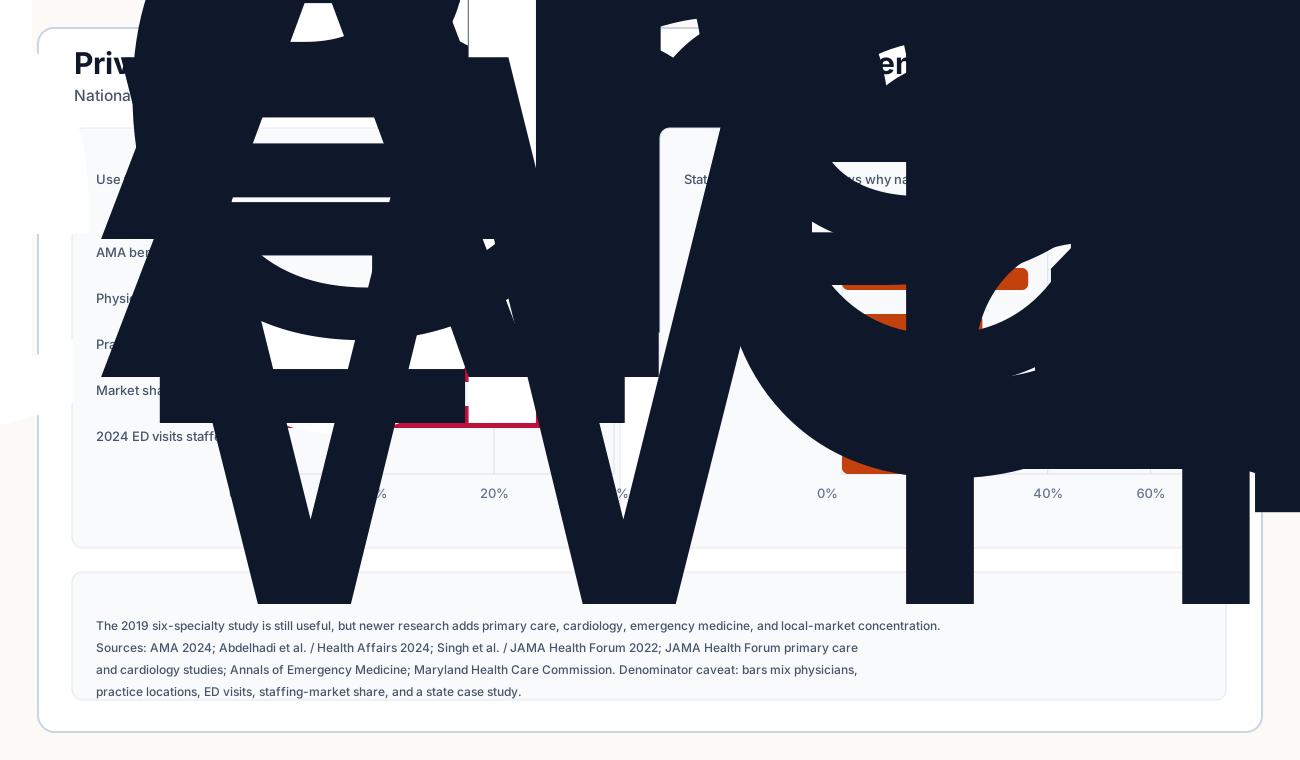
The PE read has to be both specialty-specific and denominator-specific. The older JAMA Health Forum six-specialty study still earns its place because it gives a clean national physician denominator: by 2019, 4,738 of 97,094 physicians in six office-based specialties, or 4.9%, worked in PE-acquired practices. Dermatology and gastroenterology were around 7.5%, urology around 6.5%, ophthalmology around 5.1%, obstetrics/gynecology around 4.7%, and orthopedics around 1.9%.[16]
Newer work adds more denominators. A broader Health Affairs study of 10 specialties found PE-acquired physician practice sites grew from 816 across 119 MSAs in 2012 to 5,779 across 307 MSAs in 2021; in 120 MSAs, PE firms collectively exceeded 30% market share in at least one specialty.[22] Service-line studies extend the picture: 1.5% of primary-care physicians were PE-affiliated in 2022; PE-acquired cardiology practices reached 3.9% of U.S. cardiology practice locations in 2023; and PE-owned emergency medicine groups staffed 24.7% of ED visits using 2024 ownership data.[23][24][25] Anesthesia needs a separate staffing-market denominator: a Health Affairs Scholar study estimated PE plus publicly traded company shares of 18.8% in anesthesia by 2019.[17]
| Specialty / setting | Clinic/site denominator | Doctor denominator | PE / corporate ownership metric | Best current read |
|---|---|---|---|---|
| All physicians | Not a site denominator | 1,032,365 active; 866,460 direct patient care in 2024 | 6.5% in PE-owned practices; 42.2% in private practice | Use AMA for ownership mix and AAMC for workforce scale |
| PE-acquired physician practice sites | 5,779 PE-acquired sites in 2021, up from 816 in 2012 | Not a doctor denominator | PE reached 307 MSAs; >30% local market share in 120 MSAs | Site count is acquired sites, not total U.S. clinics |
| Dermatology | Not public in the 2019 six-specialty study | 11,324 physicians in six-specialty study | 851 in PE-acquired practices, 7.5% in 2019; Maryland case study 36.2% in 2021 | One of the clearest office-based PE roll-up markets |
| Gastroenterology | Not public in the 2019 six-specialty study | 11,484 physicians | 845 in PE-acquired practices, 7.4% in 2019; Maryland case study 16.7% in 2021 | Endoscopy/ASC economics make this a core roll-up category |
| Urology | Not public in the 2019 six-specialty study | 7,609 physicians | 492 in PE-acquired practices, 6.5% in 2019; Maryland case study 63.3% in 2021 | Moderate-high nationally, but can be very high locally |
| Ophthalmology | Not public in the 2019 six-specialty study | 14,493 physicians | 741 in PE-acquired practices, 5.1% in 2019; Maryland case study 25.2% in 2021 | Procedure and ASC linkage matter |
| Primary care | Not a site denominator in the cited study | 198,097 PCPs in 2022 study | 1.5% PE-affiliated nationally; 47.9% hospital-affiliated | Low nationally, but relevant in selected regional markets |
| Cardiology | Cardiology practice locations | Not a physician-count denominator in the cited study | 3.9% of U.S. cardiology practice locations PE-acquired by 2023 | Newer roll-up category; concentrated in selected states |
| Anesthesia | Staffing market, not clinic sites | Not a physician-count denominator | 18.8% PE + publicly traded company market share in 2019 | Different denominator from office-based specialties |
| Emergency medicine | ED visits / staffing groups | Not a physician-count denominator | 24.7% of ED visits staffed by PE-owned groups using 2024 ownership data | One of the highest-control staffing categories |
| Physical therapy | PE-affiliated clinics | Not a physician market | 2,591 PE-affiliated clinics by 2024 | Useful adjacent services roll-up signal, not a physician specialty |
| Segment / specialty | Roll-up attractiveness | PE penetration read | Why |
|---|---|---|---|
| Dermatology | Very high | 7.5% of physicians in PE-acquired practices in 2019; 36.2% in Maryland case study | Office-based procedures, cash-pay mix, fragmented ownership |
| Gastroenterology | Very high | 7.4% nationally in 2019; 16.7% in Maryland case study | Endoscopy economics, ASC linkage, referral capture |
| Urology | High | 6.5% nationally in 2019; 63.3% in Maryland case study | Procedure mix, ancillary revenue, aging demand |
| Ophthalmology / retina | Very high | 5.1% nationally in 2019; 25.2% in Maryland case study | Procedure volume, ASC linkage, specialty referrals |
| Obstetrics / gynecology | Medium-high | 4.7% of physicians in PE-acquired practices in 2019 | Local fragmentation and ancillary opportunities |
| Orthopedics | High | 1.9% of physicians in PE-acquired practices in 2019 | Procedure referrals, ASC migration, sports/aging demand |
| Primary care | Medium | 1.5% PE-affiliated nationally in 2022; hospital affiliation much higher | Access control, payer contracts, value-based care, but lower fee-for-service procedure economics |
| Cardiology | High | 3.9% of U.S. cardiology practice locations PE-acquired by 2023 | ASC migration, office-based labs, imaging, chronic disease demand |
| Anesthesia | High | 18.8% PE + publicly traded company market share in 2019 | Hospital/ASC staffing contracts, workforce leverage |
| Emergency medicine | High | 24.7% of ED visits staffed by PE-owned groups using 2024 ownership data | Hospital staffing contracts and outsourced group scale |
| Radiology / imaging | High | No single current public share in this draft | Professional group + imaging-center control points |
| Dental / orthodontics / oral surgery | High | 16.1% all-dentist DSO affiliation; 22.8% orthodontics; 21.8% oral surgery | DSO control model, fragmented dentist owners |
| Physical therapy | Medium-high | 2,591 PE-affiliated clinics by 2024 | Fragmented outpatient clinic base, referral channels, musculoskeletal demand |
| Autism / ABA | High | Moderate to high | Recurring demand, staffing model, payer complexity |
| SUD / IOP / PHP | High | Moderate to high | Facility/licensure complexity plus recurring demand |
| Hospice | High | Moderate to high | For-profit provider growth, Medicare benefit economics |
| Home health | Medium-high | Moderate | Labor constraint and reimbursement risk temper roll-up logic |
| Hospitals | Low-medium | Low by facility count | Capital intensity, nonprofit/government dominance, regulation |
| FQHCs | Low | Low | Mission/nonprofit/federal funding model |
| Dialysis | Low for PE, high for corporate concentration | Low PE read | Public-chain concentration is the main structure |
Why does the national share look modest while local specialty markets get concentrated? GAO’s 2025 report is the clearest source. GAO found PE firms acquired 2,355 physician practices from 2013 through 2022, that three specialties accounted for more than half of those acquisitions, and that PE-acquired practices made up a meaningful share of several metropolitan specialty markets.[18] Maryland’s state report is the sharpest example here. By 2021, estimated PE penetration reached 63.3% in urology, 36.2% in dermatology, 27.3% in primary care, 25.2% in ophthalmology, and 16.7% in gastroenterology. Those are local figures, and they expose exactly the pattern a national 6.5% all-physician number buries.[26]
A better landscape map
For strategy work, four linked views beat one market-size chart:
| Visual | What it shows | Best use |
|---|---|---|
| Care-setting map | Hospital, clinic, ASC, dental, behavioral, post-acute, home-based, ancillary | Where the patient encounter and site license sit |
| Ownership/control matrix | Independent, small group, large group, health system, corporate chain, MSO/DSO, PE-backed, public company | Who controls operations and economics |
| Specialty roll-up heat map | Procedure intensity, fragmentation, recurring demand, referral leverage, labor risk, PE band | Which service lines are most consolidatable |
| Workforce bottleneck map | Physicians, dentists, nurses, APRNs/PAs, therapists, hygienists, aides | Where growth is constrained by labor rather than capital |
The fifth view is the control map. It is the one that most often changes a decision:

| Control point | What to inspect | Typical examples |
|---|---|---|
| Patient encounter | Where demand appears | Office visit, surgery, therapy session, dialysis treatment, hospice day |
| Clinician | Who provides professional care | Physician, dentist, RN, APRN, PA, therapist, hygienist, aide |
| Licensed site | Where the care is legally delivered | Hospital, ASC, clinic, dental office, nursing facility, agency |
| Professional entity | Who holds the clinical license | Physician PC, dental PC, medical group, facility licensee |
| Management layer | Who controls non-clinical operations | MSO, DSO, staffing company, management company |
| Payer/referral contract | Who controls volume and reimbursement | Health system, payer contract, referral network, employer channel |
| Capital sponsor | Who owns the platform economics | Owner/operator, nonprofit, public company, strategic, PE fund |
That stack beats a simple ownership label. The same service line can read independent at the license layer and consolidated at the management layer.
What to do with the map
Use the spending numbers to size the terrain. Then use the control map to pick a strategy. Hospitals are the largest spending pool, and outpatient procedural specialties may still be more roll-upable. Nursing facilities and hospice show large operator counts, and their real risk sits in labor, reimbursement, and ownership transparency. Dental reads clinically local, and DSOs can shift the economics above the practice anyway. Dialysis is no classic PE story. It stays highly concentrated through public-company scale.
The practical test is simple. Ask whether a segment can be rolled up through an MSO, DSO, staffing contract, payer contract, or management layer without owning a hospital license. If yes, private-equity penetration can move faster than facility ownership data suggests.
Appendix: sources and citations
- CMS NHE Fact Sheet - 2024 national health expenditures, hospital expenditures, physician and clinical services expenditures, GDP share, per-capita spending. Page last modified June 24, 2026.
- AHA Fast Facts on U.S. Hospitals, 2026 - hospital counts, community hospital ownership categories, staffed beds, admissions, system affiliation.
- HRSA Health Center Program Data - 2024 health center patients and service delivery sites.
- BLS Occupational Outlook Handbook pages for registered nurses, nurse anesthetists, nurse midwives, and nurse practitioners, physician assistants, physicians and surgeons, and dentists - 2024 occupational job counts. BLS blocked direct shell retrieval in this environment; counts were recorded from search-visible BLS snippets and should be refreshed directly before publication.
- USAFacts: How many nurses are there in the U.S.? - secondary summary of BLS nurse employment, used only for a broad all-nurse wrapper.
- AMA 2024 Physician Practice Benchmark Survey - private practice share, employed/owner shares, hospital ownership, practice-size distribution, and PE-owned practice share.
- MedPAC March 2025 ASC chapter - Medicare-certified ASC count and growth from 2022 to 2023.
- SAMHSA 2023 N-SUMHSS annual release - eligible substance-use and mental-health treatment facility count.
- KFF nursing facility characteristics, 2025 - CMS-certified nursing facility count as of July 2025 and 2015-2025 facility decline.
- MedPAC skilled nursing facility topic page - freestanding SNF count and Medicare-covered stays/beneficiaries.
- MedPAC March 2026 hospice chapter - hospice provider count, Medicare beneficiaries served, and Medicare hospice expenditures.
- MedPAC March 2026 dialysis chapter - outpatient dialysis facility count and FFS beneficiaries served.
- ADA Health Policy Institute dental practice research - preferred source family for active dentists, practice ownership, and DSO affiliation.
- PubMed private-equity-in-dentistry abstract - peer-reviewed index record for dental PE literature and DSO/control-layer caveats.
- AAMC 2025 key findings - 2024 active and direct patient-care physician counts.
- Singh et al., JAMA Health Forum 2022: Geographic Variation in Private Equity Penetration Across Select Office-Based Physician Specialties in the US - specialty-level physician counts and PE-acquired practice shares for dermatology, gastroenterology, urology, ophthalmology, obstetrics/gynecology, and orthopedics.
- Adler, Milhaupt, and Valdez, Health Affairs Scholar 2023: Measuring private equity penetration and consolidation in emergency medicine and anesthesiology - PE plus publicly traded company market share in anesthesia and emergency medicine.
- GAO-25-107450: Private Equity - Status of Ownership and Consolidation in Health Care Markets - 2013-2022 physician-practice acquisitions and market-concentration findings.
- NIHCM: Private Equity Ownership of Physician Practices - summary of PE-acquired practice-site growth and MSA concentration from the Health Affairs 2012-2021 study.
- ADA Health Policy Institute 2024 dentist practice modality workbook - dentist practice-size distribution and DSO affiliation by career stage, sex, specialty, and state.
- ADA Health Policy Institute Supply of Dentists, 2024 - professionally active dentist counts by specialty and state.
- Abdelhadi et al., Health Affairs 2024: Private Equity-Acquired Physician Practices And Market Penetration Increased Substantially, 2012-21 - PE-acquired physician practice-site growth, 10-specialty MSA market-share analysis, and local concentration findings.
- JAMA Health Forum 2025: Growth of Private Equity and Hospital Consolidation in Primary Care and Price Implications - 2022 primary-care physician PE and hospital affiliation estimates.
- JAMA Health Forum 2024: Trends in Private Equity Consolidation in Cardiovascular Care - 2019-2023 cardiology PE acquisitions and practice-location penetration.
- Annals of Emergency Medicine 2026: Emergency Physician Employer Market Share and Concentration by Ownership Type - ED visit share by emergency physician employer ownership category using 2024 ownership data.
- Maryland Health Care Commission: Private Equity Investments in Physician Practices in Maryland - state-level 2021 specialty PE penetration estimates and local-market caveats.
- PubMed: Trends in Private Equity Acquisition of US Physical Therapy Clinics, 2010 to 2024 - PE-affiliated physical therapy clinic count and platform concentration.