Health AI distribution build vs. buy — illustrative math (Part 2 of 2)
Part 2 of the series. If an AI-native company set out to build Phreesia's ~4,700-organization distribution and ~$4B/yr payment rails from scratch, what would it cost in dollars and years? A bottoms-up look at replication cost and pace, the payments moat, customer lifetime value, a grounded re-rating (a 4-5x combined revenue multiple implying ~$2.4-3.0B), and the deal mechanics: reverse merger, PIPE, and the IPO window.
Health AI Distribution: Build vs. Buy, Part 2 of 2. Part 1, “Health AI distribution build vs. buy, Phreesia primer,” laid out the business, the valuation paradox (a profitable incumbent at ~1.3x sales sitting next to AI-native peers at 40-100x), and the strategic-asset thesis. This piece quantifies it: what that distribution would cost an AI-native company to build on its own, the combination economics, and the deal mechanics. It stands alone, and Part 1 is the primer.
How to read this. A point-in-time analysis as of June 2026; figures move and are directional. The CLTV, CAC, build-cost and re-rating figures are illustrative and assumption-driven (the swing variables are flagged inline), and private-round valuations are primary-market marks, not mark-to-market. This is analysis, not investment advice.
Framing: a general pattern, with Phreesia as the example case study
This is about a pattern. One company happens to illustrate it. An AI-native product leader weighs organic scale against acquiring an incumbent’s distribution and data moat, and that choice is not zero-sum. Phreesia is the case study, the incumbent whose distribution, payments, and data moat we examine in detail. An illustrative AI-native access leader, a fast-growing, voice-native patient-access company we’ll simply call “the AI-native scaler,” stands in as the party weighing the move. The logic applies to any AI-native scaler facing an entrenched distribution incumbent.
Here is the systems-thinking thesis underneath it. Startups over-index on scaling and organic growth and underweight strategic capability: distribution, data, embedded workflow, public-market access, until it’s expensive or too late. Pure-organic compounding is the default reflex. A strategic move that combines a product lead with an incumbent’s hard-won moat sits in the blind spot most founders never check. Wait too long and the option set can narrow. Dilution mounts, incumbents adopt frontier capability across bases they already own, and the founder can end up with less control over the company’s destiny, not more. The point is not “do a deal.” It is to hold the strategic and organic paths in the same frame, early, while you still have leverage over which one you choose. With the right framework, 1 + 1 can be greater than 3, the combined whole worth meaningfully more than the parts.
Why a founder should care. This kind of value creation is usually filed under private equity, something the operators whose category is in play rarely run, which is exactly why it is worth an AI-native founder’s attention. The gains can be large and fast, and they come from recognizing distribution and data as the scarce assets before the public market re-rates them:
| Example | Move | Why it matters to a founder |
|---|---|---|
| Ellie Mae: Thoma Bravo take-private → ICE exit | ~$3.7B take-private; ~$11B sale about fifteen months later | Workflow distribution and embedded mortgage rails were worth much more inside a strategic platform than as a mature public software company. |
| athenahealth: Veritas / Evergreen take-private → Bain + Hellman & Friedman exit | ~$5.7B take-private; ~$17B exit within a few years | Health-IT assets with sticky workflows, revenue-cycle data, and distribution can re-rate quickly when operated with a sharper strategic lens. |
| Bending Spoons IPO after buying brands like AOL, Vimeo, and Eventbrite | July 2026 IPO; early trading around ~$23B market cap and ~16x EV/revenue | A software operator can buy out-of-favor but durable brands with embedded distribution, centralize product/data/AI operations, and earn a public-platform multiple if the market believes the operating system scales. |
A leader that holds this lens early keeps the initiative on its own category rather than leaving the move to a sponsor or a strategic. Part 8 collects more of these precedents; the rest of this piece works the logic through Phreesia.
Bottom line
Two pieces of Phreesia are genuinely hard to build and slow to rush: a ~4,700-organization installed base (which even the incumbent grows by only ~300/year) and $4B/year of embedded patient-payment rails (which a practice typically can’t switch cleanly without touching its EHR/PM system). An AI-native scaler, in our example, has neither, and funding alone doesn’t compress the 9-to-18-month healthcare sales-and-implementation clock.
The interesting move is to do both. The AI-native company keeps scaling organically and combines with Phreesia, where Phreesia supplies instant distribution, the payments rails, and a public listing, and the AI-native side supplies the product and growth. The question that decides it is whether the combined entity is worth materially more than the ~$1.9B sum of the two standalones, by enough to cover dilution and integration. The case for “yes” rests on time-compression and the payments rails; the honest unknown is the size of the synergy, not its direction.
One caution the funding math tends to underweight is the incumbent’s own management. Phreesia is founder-led. Chaim Indig has run the company since he co-founded it in 2005, and has spent roughly two decades on patient access and the administrative front door, the same problem the AI-native entrants are now attacking. A team that has shipped intake, payments, and network products across thousands of organizations for twenty years, and that turned on its own voice AI across that base in 2025, moves faster than the surface reading suggests. Read it as nimble challenger versus tired incumbent and you will misread it. A founder-led incumbent that can light modern AI across an installed base it already owns is precisely why distribution, not the model, is the durable moat, and why the argument here is to act while the window is open. The incumbent will keep moving.
Part 0: an anchor. A discounted-cash-flow (DCF) value of Phreesia is close to its market value
Before weighing what the assets are worth strategically, it helps to anchor how the public market is valuing Phreesia’s cash flows on a conventional, like-for-like basis: a simple discounted-cash-flow value of its free cash flow. The model is a growing perpetuity, DCF value = normalized free cash flow × (1 + growth) ÷ (discount rate − growth), with three transparent inputs:
| Assumption | Value used | Why |
|---|---|---|
| Normalized annual free cash flow | ~$70M | Phreesia FY26 free cash flow was $67.7M; LTM ~$63-76M |
| Long-term FCF growth rate | 2-3% per year | Deliberately conservative, below recent growth, reflecting the FY27 deceleration |
| Discount rate (cost of capital) | 11-12% | A public-company cost of capital for a profitable, slow-growth health-IT business |
Across those inputs the DCF lands in a tight band, about $0.7-0.9B (≈$715M at 2% growth / 12% discount, up to ≈$900M at 3% / 11%), essentially Phreesia’s ~$683M market enterprise value, with the market near the low end (consistent with the recent deceleration1). Today’s market price is explicable by a plain reading of the visible cash flows on conservative assumptions. You don’t have to assume the market is making an error to land near today’s price. That speaks to how public investors appear to be capitalizing the current cash flows; it is not a verdict on intrinsic value. (Separately, the gross-profit “CLTV pool” in Part 1, ~$1.3-1.85B depending on the discount rate, measures revenue durability rather than serving as a second valuation, and it is not comparable to enterprise value because it ignores the opex, R&D, and G&A needed to earn it.)
The implication for the rest of this analysis is narrower than “fairly valued.” A quick DCF like this can only show that the public-market price is consistent with the visible cash flows on conservative assumptions; it says nothing about intrinsic value, which would take a deeper fundamental dive into product differentiation, competitive moats, and the durability of each revenue line than this piece attempts. So we set that question aside rather than resolve it. The strategic case here holds regardless of whether the market is right about Phreesia’s standalone cash flows. It rests on the distribution and payments assets plausibly being worth more inside an AI-native operator than to public shareholders pricing a slow-growth incumbent, because replicating them organically would take a rival the better part of a decade (Parts 2-3). That is a claim about strategic fit and replication cost, held apart from any claim about whether the stock is mispriced.
Part 1: what a Phreesia customer is worth. ACV and lifetime value (CLTV)
Per-customer economics (FY26). Total revenue per provider organization, at the company’s blended gross margin:
| Metric | Value | Basis |
|---|---|---|
| Revenue per organization (subscription + payments + network) | ~$106.5k | $480.6M ÷ 4,514 orgs |
| Gross margin | ~68% | Phreesia FY26 (company basis) |
| Annual gross profit per customer | ~$72k | $106.5k × 68% |
Lifetime value runs on two forces. Phreesia customers are sticky (≈99% logo retention), and they expand (revenue per org grows as payments and network cross-sell layer on). Modeling both, conservatively, ~10% churn netted against ~3% annual expansion2, leaves CLTV sensitive mainly to the discount rate. A 20% venture-grade rate runs harsh for a profitable, cash-generative public company with a sticky, expanding base (12% is more defensible), so we show both and anchor the rest of the analysis on the most conservative point:
| Discount rate | CLTV per customer | Aggregate (× ~4,700) |
|---|---|---|
| 12% (profitable-public cost of capital) | ~$393k | ~$1.85B |
| 20% (conservative anchor used below) | ~$276k | ~$1.3B |
How these figures are used. Of the $106.5k, ~$75.5k is direct subscription + payments the provider pays. That’s the basis for the replication-CAC math in Parts 2-3 (the ~$31k balance is pharma-funded network revenue the base enables, which is more cyclical). CLTV anchors the LTV:CAC check in Part 2, carried at the conservative $276k (20%), even though 12% would put it near $393k, so nothing downstream rests on a generous valuation. The aggregate (~$1.3-1.85B) is a gross-profit durability pool, not an enterprise value, and not comparable to the ~$683M EV (Part 0’s net-FCF DCF is the EV-comparable figure). The base is sticky, expanding, and valuable. How hard it is to build is the question, and it comes next.
Part 2: pace is the binding constraint on reaching Phreesia’s scale
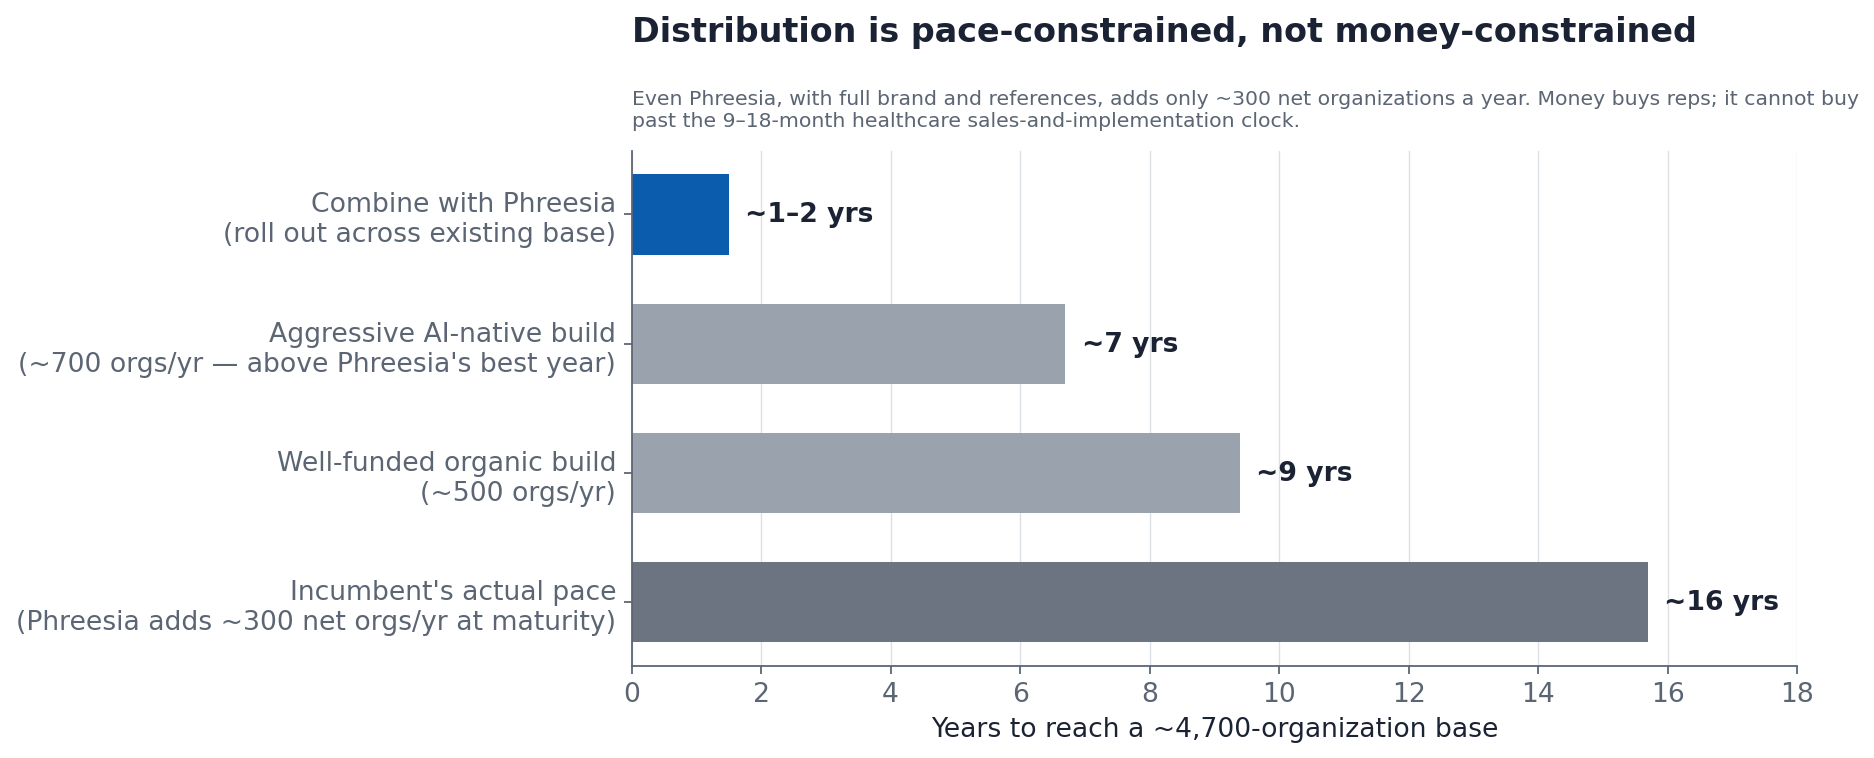
Selling and standing up 4,700 provider organizations is a logistics problem that money only partly solves:
- Sales cycle. 9-to-18 months for health systems and large groups (RFPs, security review, clinical validation, annual budget cycles); 60-to-90 days for small practices. Hire more reps and you run more cycles in parallel, but each cycle’s length is fixed.
- Technical setup per customer. Every logo needs EHR/PM integration, workflow configuration, staff training, and a monitored go-live. That consumes implementation and customer-success capacity that also has to be hired and ramped (3-to-6 months per rep), and it caps how many new orgs you can absorb per year regardless of pipeline.
- Market receptivity. The pool of organizations ready to adopt and switch in any given year is finite.
The tell is the incumbent’s own pace: Phreesia, with full brand, references, and a 20-year head start, nets only ~300 new organizations a year. A new entrant, even very well funded, realistically adds ~300-700/year, so reaching ~4,700 from zero is a ~7-to-16-year project by that logo-by-logo motion. A bigger S&M budget bends that number only slowly, which is why “just outspend them” wins practices one at a time poorly (a different motion, like portfolio or health-system deals, can change the math).
The standalone build cost: what an AI-native scaler would spend to reach Phreesia’s footprint alone
Put dollars on it. The cost to stand up the base is roughly the logos you must win × the cost per logo, the ~4,700 target plus the churn replaced over a multi-year build, which ties cost directly to the pace scenarios above:
| Standalone path | CAC / logo3 | Years (pace-limited) | ~Gross logos incl. churn | Cumulative S&M to build |
|---|---|---|---|---|
| Legacy GTM (reps, RFPs, 9-to-18-mo cycles) | ~$125k | ~9-16 yrs | ~5,500-6,500 | ~$700-900M |
| AI-native GTM (product-led, faster deploy) | ~$55k | ~5-9 yrs | ~5,000-5,800 | ~$280-450M |
(Cumulative S&M ≈ gross logos × CAC; the upper end of each range also absorbs rising marginal CAC and ramp inefficiency on the back half of a build, which is why it runs above the clean logos × base-CAC figure.)
Take an AI-native leader trying to replicate Phreesia’s specific installed base on its own: the long tail of independent and small-group practices, won largely logo-by-logo. A high-level estimate is ~$280-450M and ~5-9 years in the optimistic AI-native case, or ~$700-900M and ~9-16 years on legacy economics, and that buys just the customer relationships. These are order-of-magnitude figures for that motion, not a ceiling. A scaler could win reach differently, through large health-system or EHR partnerships, portfolio-wide roll-ins across a PE sponsor’s MSO/PPM footprint (many locations per signature), or product-led and viral adoption, and compress both the cost and the clock. That is part of the point: how you acquire distribution matters as much as the sticker price. It doesn’t count the additional value the embedded $4B payments rails would layer on top (Part 3b). Live, trusted rails let an AI-native agent move from call deflection into revenue capture (collections, payment plans, propensity-to-pay), plus AccessOne’s harder-to-replicate financing. This is pre-profit S&M funded with equity at a venture-stage company. Financing even the optimistic ~$280-450M case means years of burn and meaningful dilution (very roughly ~15-30% at venture valuations). And the legacy case clears only a modest LTV:CAC, ~2.2x at the conservative discount, ~1.6x on direct provider revenue alone. One mitigant on the build side: a builder doesn’t strictly need all 4,700. The most AI-receptive ~1,500 organizations capture much of the data, reference, and distribution value, though that targeted build still forfeits the payments rails and the full reach a combination delivers.
A Phreesia combination removes most of this standalone build cost; the base comes with the deal rather than being won logo-by-logo over years, which is why Parts 3-4 weigh it against combining rather than going it alone.
Part 3: the two hard-to-build assets (and the rest of the moat)
3a. Distribution, and the upgrade-in-place channel
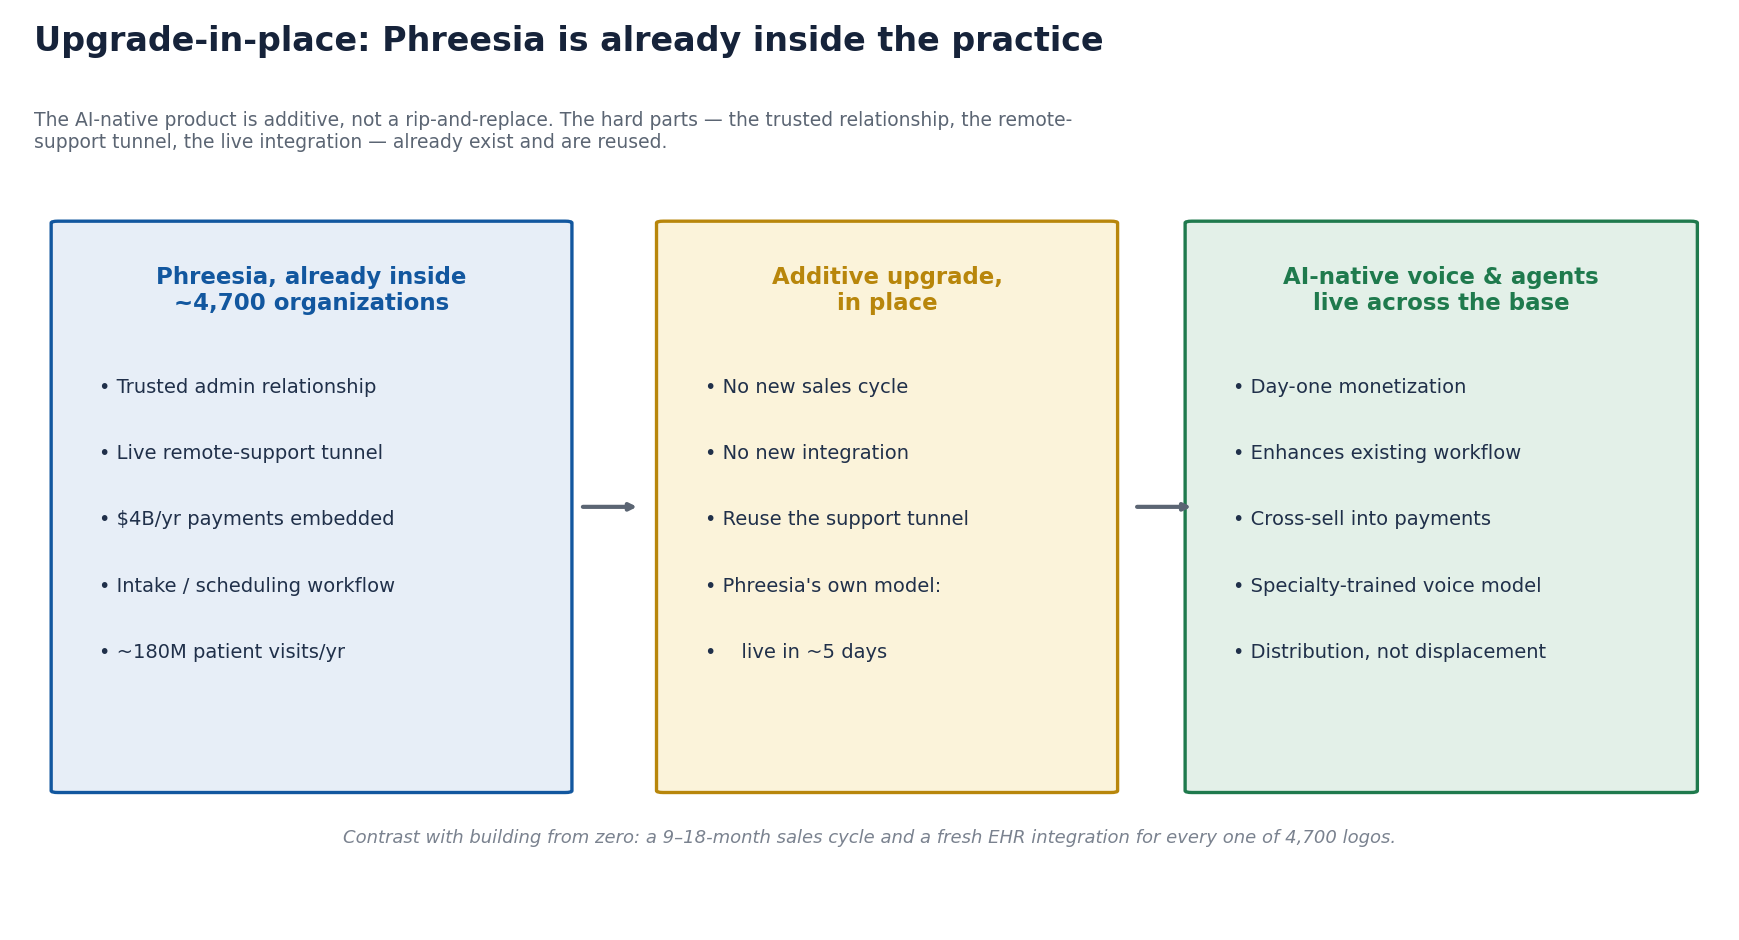
This is the part that standard “cost to acquire a customer” math misses entirely. If Phreesia is already inside a practice, much of the hardest work is already done and is reusable. The practice’s administrators have a trusted relationship with Phreesia; there is a live remote-support tunnel into the workflow; the EHR integration exists; the payments are already flowing. Pushing the scaler’s AI voice and agents into that account is an additive upgrade-in-place, not a new sale and not a rip-out, the same motion Phreesia already runs (its own VoiceAI markets a ~5-day go-live across the base).
So a combination hands the acquirer more than 4,700 logos. It hands them 4,700 warm, integrated, already-supported accounts, a relationship to upgrade from rather than years spent winning each one. Converting them to a new product still takes work, from a far shorter starting line. Consider the two clocks side by side. Organic, you run a 9-to-18-month cycle and a fresh integration for each of 4,700 orgs. In place, you reuse the channel that’s already there. This is the biggest reason the combination compresses time, which Part 2 shows is the scarce resource.
3b. The $4B payments rails: embedded, sticky, and hard to displace
Phreesia processes over $4 billion of patient payments a year (payments are ~26% of its revenue), embedded directly in the intake and check-in workflow of thousands of practices. Payments are buildable. With modern fintech rails (Stripe and the like), a well-funded company can stand up processing if it chooses to. The incumbent position is what stays hard to displace, and a few of the pieces compound in ways money alone doesn’t shortcut:
- Embedded payments are deeply sticky. When processing is wired into a practice’s core intake/PM workflow, switching it out usually means a workaround outside the system, or, in the harder cases, touching the EHR/PM platform itself. That switching cost, plus the operational fear of disrupting how the practice actually gets paid, keeps the rails in place far longer than a typical SaaS subscription.
- It’s core to every practice’s daily money movement. Patient payments are how the practice gets paid, which is exactly why a voice agent that can act on payments (collect balances, set up plans, post to the ledger) is worth more sitting on top of live, trusted rails than as a standalone bolt-on.
- The data and the integrations are the real head start. Years of patient-payment data (propensity-to-pay, plan behavior) and the per-practice billing/PM integrations are an accumulated asset, not a checkbox: the part that takes time rather than money.
- AccessOne is the genuinely hard-to-build piece. Phreesia’s acquired patient-financing business (funded receivables) is materially harder to recreate than vanilla payment acceptance: it’s a balance-sheet / lending operation with its own licensing, PCI scope, compliance, and capital requirements. That, more than processing itself, is the kind of asset a combination delivers that simply integrating a processor would not.
Whether the scaler would build payments in-house or simply integrate a processor is its own call and out of scope here. The narrower point: the rails Phreesia already owns are sticky, data-rich, and (in AccessOne’s case) capital-intensive to recreate, so they tilt the math toward combining rather than re-originating from zero, and they give the scaler’s agent a path from cost-saving deflection toward revenue capture across $4B of live volume.
3c. The rest of the moat: what else a combination delivers (and a builder can’t rush)
Beyond the base and the rails, a deal inherits a stack of assets that a “$X CAC × 4,700 logos” model ignores entirely, and that a standalone build would have to recreate one by one:
- A 60+ EHR/PM integration surface, already built, certified, and maintained. This is a multi-year engineering commitment that gates every deal, and the thing that makes the upgrade-in-place channel (Part 3a) actually work.
- An inherited pharma/network monetization engine (~$140M). Phreesia already runs a pharma-funded business on top of its patient touchpoints, a built channel that’s hard to stand up before you have the base (chicken-and- egg). It’s been decelerating lately, which is precisely where an AI-native owner with better targeting and measurement could re-accelerate an asset the market is currently writing down. For an AI-native owner it’s an optional second revenue engine that comes free with the base, an at-risk line reframed as an upside one.
- A compounding data/model asset, ~180M visits/year and 20+ years of workflow intelligence, that improves product quality and can’t be backfilled with capital in year one.
- Cleared regulatory and security posture, HIPAA, SOC 2, HITRUST, BAAs at enterprise scale: table stakes a new entrant pays for in time before the first large deal closes.
- Brand and a reference base. Provider procurement is risk-averse and reference-driven; the incumbent’s trust is a cold-start cost a builder eats on every deal.
- Time and founder focus. Every year not spent standing up a 200-rep healthcare GTM org is a year spent on the AI product, which is the scaler’s actual edge, and the thing dilution-funded GTM years quietly trade away.
None of these show up in a CAC table. Together they are why the honest cost to build the equivalent plausibly sits above the ~$280-900M cash figure, and why the combination’s value comes as much from what an acquirer doesn’t have to build as from the base itself.
Part 4: build, combine, or both, since the paths coexist
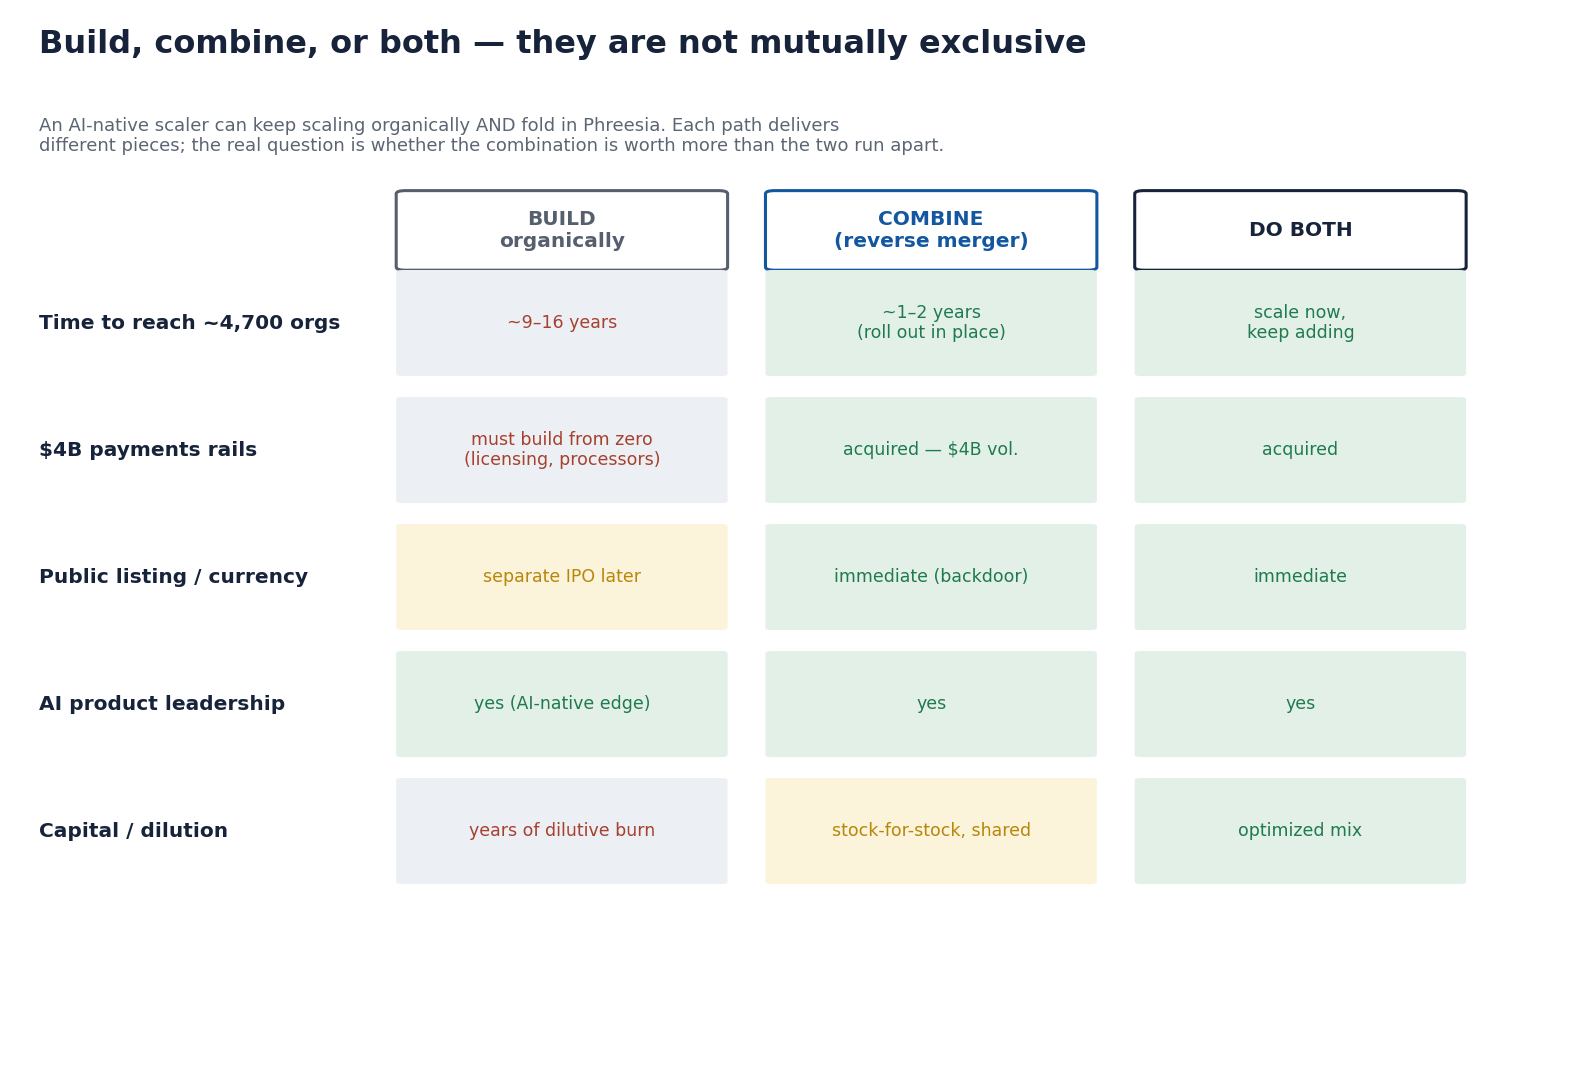
An AI-native scaler can keep scaling organically and fold in Phreesia. Each path delivers different pieces, and the combination delivers all of them at once: instant distribution, the payments rails, a public listing, and the AI-native product, with the capital structure optimized across both.
So the real question is whether the combined entity would be worth materially more than the sum of the two standalones, by enough to cover dilution and integration friction. The sources of upside are concrete even where the total isn’t precisely knowable:
- Time-compression of distribution, upgrading ~4,700 in-place accounts in months against a ~7-to-16-year organic build (Parts 2-3a).
- The payments rails, a new revenue surface for the scaler’s agent, with AccessOne’s financing the hardest piece to recreate (3b).
- A public listing and currency, a lower, public cost of capital to fund growth.
- Upgrade-in-place revenue uplift, the scaler’s product monetized across Phreesia’s base; Phreesia’s product modernized by the scaler’s AI.
Against those: integration and culture risk, dilution, the distraction of running a public company, and the shared risk that EHRs (Epic) bundle the front door and compress the prize for builder and buyer alike. Part 5 sketches one illustrative structure to make these trade-offs concrete. Emphasis on illustrative.
Part 5: a hypothetical, illustrative combination scenario
Purpose and method. A high-level illustration to make the earlier points concrete, not a proposed transaction or diligenced math. Structure, valuations, and ownership splits would all require diligence; the numbers are placeholders to anchor discussion.
One structure people reach for when an AI-native private company wants public-market access and distribution is a reverse merger, combining with a public company that becomes the listing vehicle, in place of a cash take-private at a control premium. At a high level:
- the AI-native scaler (private, illustratively ~$1.2B last-round mark) is the larger entity by current marks; Phreesia (~$0.67B fully-diluted equity, a depressed multiple, decelerating growth) would be the public vehicle.
- In a stock-for-stock combination, ownership would be split by negotiated relative value and expected synergies, a number diligence would have to settle. The structural point that does matter: for a deal like this to make sense for the AI-native company, its founders and shareholders would expect to retain controlling interest and board/voting control, because the AI-native team has to be the one driving and executing the value creation, holding the majority rather than a minority in someone else’s company.
- Phreesia’s depressed valuation and thin investor interest lower the entry cost; the framing is the opposite of paying a rich control premium. Exact terms (exchange ratio, any premium, debt vs. equity, lock-ups) are precisely what diligence would settle and are deliberately not modeled here.
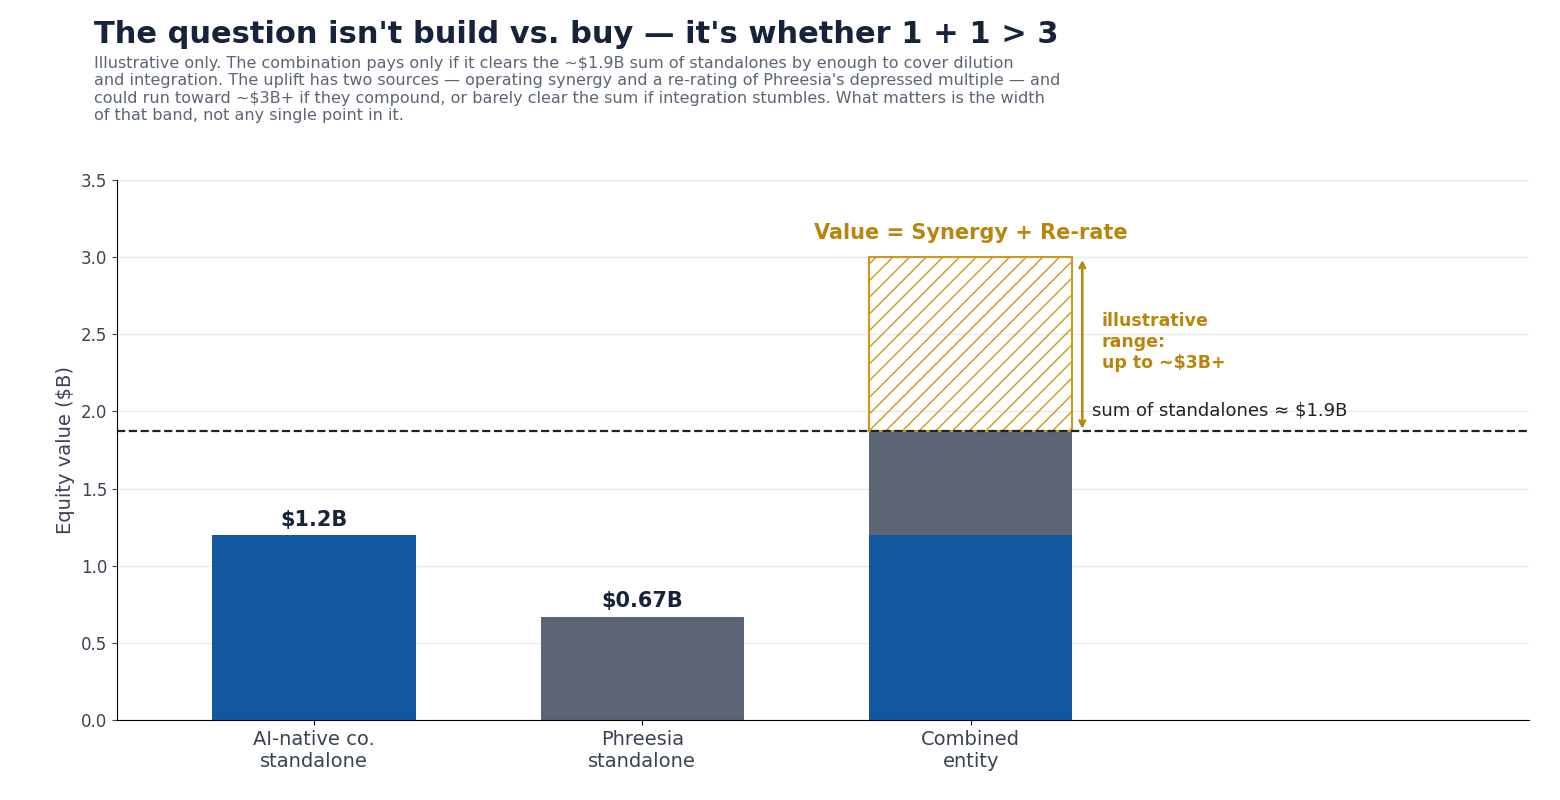
The chart lays out the core question. Run apart, the two companies are worth on the order of ~$1.9B combined at current marks. A combination is worth pursuing only if the combined entity would be worth materially more than that, and the plausible range is wide: if the synergies (instant distribution, the payments surface, a public listing, upgrade-in-place uplift) compound, combined value could run toward ~$3B or beyond; if integration stumbles or the base keeps decelerating, it may barely clear the sum. What matters is the width of that band. The upside is large enough to take seriously, and uncertain enough to demand real diligence.
5a. Where the value uplift could come from, illustrative
Purpose and method. Back-of-envelope illustrations of the kind and scale of value, not forecasts. Multiples and adoption rates are assumptions diligence would replace. None of these is required for the strategic case (see the close).
The uplift labeled “Value = synergy + re-rate” has two sources: operating synergies and a re-rating of the combined multiple. The re-rating follows from what the combination does to growth. The durable value driver is execution. The combination accelerates the AI-native scaler’s growth flywheel: instant distribution across ~4,700 organizations, the payments surface, and ~180M visits of data. The market re-rates the combined business as it proves that out.
1. Re-rating, the market’s recognition of an accelerated flywheel. The combined business would do roughly ~$600M of revenue (~$510M Phreesia plus an illustrative ~$90M for the AI-native side). That ~$90M is a forward, at-scale figure, not current revenue. The AI-native scaler is fast-growing and still small today (illustratively, low tens of millions of revenue), so ~$90M is a plausible run-rate by a combination horizon. It is the softest input here, and the conclusions do not hinge on it. Phreesia trades at ~1.3x forward revenue today as a decelerating incumbent; quality health-IT and growing software trade well above that. A combined entity that pairs an AI-native product leader with massive embedded distribution tells a different equity story, an AI-leader with distribution, and can support a 4-5x revenue multiple. Grounded in earnings, that range implies a sensible EV/EBITDA:
| Blended EV / revenue on ~$600M | Implied combined EV | Implied EV / pro-forma EBITDA* |
|---|---|---|
| 4x | ~$2.4B | ~16x |
| 5x | ~$3.0B | ~20x |
*Assumes a ~25% steady-state EBITDA margin on ~$600M (~$150M), roughly Phreesia’s own near-term adjusted-EBITDA margin, with the scaler’s software margins lifting it at scale.
At 4-5x the combination is worth ~$2.4-3.0B against the ~$1.9B sum of the standalones, the “1 + 1 > 3” outcome. The implied ~16-20x EV/EBITDA is in line with quality software and health-IT, well short of an AI-native moonshot, which is the point: the re-rating doesn’t require heroic multiples, only the market coming to see the combined entity as a growing AI-leader-with-distribution in place of a decelerating incumbent. That recognition is earned by executing the flywheel (Part 5b is the bear case on whether it is). It has to be earned, not assumed. (Bases: a revenue multiple yields enterprise value; combined net debt is modest, so EV ≈ equity, and the ~$1.9B sum is an equity figure, close enough to compare.)
2. Illustrative revenue synergy (ACV lift from upgrading the base). Deploying the AI-native scaler’s voice and agents across the ~4,700-org base can lift revenue per organization (higher-value workflow, more payment capture). Incremental recurring revenue, by ACV lift × share of the base adopting (on the ~$75.5k direct ACV × 4,700 ≈ $355M base):
| ACV lift ↓ / share of base → | 40% | 60% | 80% |
|---|---|---|---|
| 20% | ~$28M | ~$43M | ~$57M |
| 30% | ~$43M | ~$64M | ~$85M |
| 40% | ~$57M | ~$85M | ~$114M |
Illustrative napkin math only. Another napkin angle: if the scaler’s agents do the work of an FTE a practice would otherwise pay ~$60K/year, and the scaler prices that capability at ~$30K, then ~$30K × 4,700 ≈ $141M of annual revenue opportunity across the base.
3. Other levers (qualitative). Payments-capture uplift, the scaler’s agent driving collections, plans, and propensity-to-pay across $4B of volume; cross-selling the AI-native product into Phreesia’s pharma/network relationships and re-accelerating that decelerating business with better AI targeting; modest cost synergy (overlapping G&A, shared infrastructure); and a lower public cost of capital.
Floor and upside. Separate the near-certain from the execution-dependent. A floor holds even if the re-rating never lands: a public listing and a lower cost of capital, the defensive value of denying the distribution and payments rails to a competitor, and the day-one operating headroom of monetizing the scaler’s product across Phreesia’s base. The upside is the re-rating, and it is earned, not assumed: it is the market pricing in an accelerated growth flywheel as the combined entity proves out as an AI-leader-with-distribution. So the honest shape is a floor near the sum-of-parts plus an execution-dependent climb toward ~$2.4-3.0B, the bull case if the flywheel delivers, with Part 5b the bear case if it doesn’t.
5b. The honest counter-case, in a market with room for several winners
A caution before the bull case runs away with itself. Healthcare is not a fixed prize. There’s enormous latent, unmet demand for software and AI agents that strip cost and friction out of patient access and the back office; the market is growing fast, with room for several winners. So the real question is not who out-maneuvers whom. It is who pairs the best product with real distribution, because in this space you need both. Product without distribution scales slowly (Parts 2-3). Distribution without a frontier product gets commoditized. The combination’s appeal is that it assembles both at once, one path to that end among others, and not a foregone conclusion. Three things still have to be true:
- The product edge has to be real and durable. Phreesia has launched its own VoiceAI and markets strong numbers (~80% deflection, 5-day go-live), recent, vendor-disclosed, unaudited, and this soon after launch its true quality is an open question. If incumbents close the product gap, the combination loses appeal (though in a market this large, more than one player can thrive). The logic leans on the scaler’s product being meaningfully ahead and staying there, which Parts 1-3 assume rather than prove.
- The re-rating is earned, not given. The market has to come to see the combined entity as a growing AI-leader-with-distribution in place of a decelerating incumbent (Part 5a): a recognition won through execution, a multiple no one is owed.
- Both sides have to want it, and the prize can shift. A combination is a negotiation over structure, control, and vision, something no single side imposes. And Epic (and the EHRs) bundling patient access could commoditize the front door for builder and incumbent alike before any deal closes.
The conclusion is the optimistic case restated as a condition: in a large, non-zero-sum market, the durable winners pair the best product with the deepest distribution. The combination is a credible way to assemble both, and its value rests on execution and a growing market, not on out-leveraging anyone.
Part 6: the cost of standing still
Why weigh a strategic move now rather than defaulting to pure organic growth? Because of where AI value is accruing. As frontier model capabilities converge and become available by API, the raw model layer is commoditizing. A genuinely good applied product still takes years to build and tune, and the underlying intelligence is rarely the durable advantage on its own. The moat is the product plus what compounds around it: distribution, proprietary data, and embedded workflow. These are the assets that grow harder to dislodge as the raw intelligence around them grows cheaper. That reframes build-vs-combine as a question of timing, and three forces make the clock matter.
Distribution is the scarce asset, and it’s a race. a16z’s Alex Rampell framed the classic version: the contest between a startup and an incumbent comes down to whether the startup reaches distribution before the incumbent reaches innovation. In the AI era it tilts even further toward distribution. Product still matters, since a well-built applied product remains hard to replicate, and the raw model layer underneath it is increasingly rentable by API, while distribution is not. Phreesia’s ~4,700 organizations and $4B in payment rails are the kind of distribution that’s very hard to spin up on demand: among the slowest things to build (Parts 2-3), and the easiest for a better-funded rival to reach first.
Commoditized intelligence cuts both ways. The same API access that lets an AI-native challenger punch above its weight also lets entrenched players (Phreesia itself, Epic, the EHRs) bolt frontier capabilities onto bases they already own. HBR has framed agentic AI as a real threat to incumbents; the mirror image is that an incumbent improving its product across an installed base it already owns can out-run a challenger assembling a 9-to-18-month-cycle GTM org from the outside (Part 2). A real product lead still matters. It’s most durable when paired with the data and distribution to defend it, since the raw-model gap between competitors compresses fastest.
Capital is chasing the same front door. Record funding is flowing into healthcare AI, and Sequoia’s “$600B question”, the widening gap between AI infrastructure spend and the application revenue meant to justify it, captures the pressure. Applied to patient access, it means a crowded field of well-funded entrants competing for the same ~50,000 addressable organizations: a spending race that favors whoever already holds distribution.
The point is not “must acquire.” It is that when reach and data are the slowest parts of the moat to build, an AI-native leader should weigh strategic moves (distribution, data, embedded workflow) alongside continuing to build the best product, rather than in place of it. A strong product is necessary; pairing it with distribution a rival can’t quickly rent or rebuild is what makes the lead durable. Standing still on distribution while the model layer keeps commoditizing is the quieter risk.
Part 7: the strategic-alternatives window. Timing and the reverse merger
Parts 1-6 cover what the assets are worth and why they are hard to build. This section adds factual context on when and how an AI-native company could access public markets: the current IPO-market backdrop and the reverse-merger structure, with precedents.
The public-market window is open now, and windows shut. By several accounts 2026 is on track to be among the largest IPO years on record. SpaceX completed the largest IPO in history in June 2026 (~$75B raised, ~$1.8T value); Anthropic and OpenAI have both filed confidentially to list later in the year; and bankers see 10-15 major tech listings as the AI window reopens after several muted years. Public appetite and a lower cost of capital are more available now than in the prior few years. Windows like this open and close, and the current one is unusually active: a factual backdrop for any company weighing public-market access, held short of a prediction about how long it lasts.
Going public has also moved later. Companies now IPO at a median age of ~12-14 years and ~$218M of revenue, typically at Series E/F or large crossover rounds, because abundant private capital lets them mature privately. By that yardstick a Series C company is early. The conventional route would be several more private rounds over several years before a traditional IPO; a reverse merger is one of the few structures that can decouple public-market access from that long private maturation. That long private path carries its own costs to founders and teams. Employee equity stays illiquid for years, each additional round adds dilution and stacks investor preferences, and retention and recruiting get harder without a tradeable currency. All the while, the eventual IPO stays exposed to whether the window is open when you need it. Earlier public-market access can ease those pressures, and public-company life carries its own costs (scrutiny, short-term pressure, compliance, volatility).
A strategic reverse merger can deliver a listing and distribution in one move. Two structures share the name. A shell reverse merger drops a private company into an empty public shell purely to get listed. A strategic (operating-company) reverse merger combines the private company with a real, operating public company, so the combined entity gets the listing and the operating assets, distribution, and cash flows. The Phreesia case is the second kind: Phreesia is a profitable operating company, not a shell. Either way the path is faster (~3-to-6 months) and less dependent on a perfect IPO window than a traditional IPO (~12-18 months), which can matter when a window is open but unpredictable.
Mechanically, the AI-native company is the one going public. Under reverse-acquisition accounting (ASC 805 / IFRS 3), when the private company’s shareholders end up with control, the private company is the accounting acquirer even though the public company is the legal acquirer. The combined entity’s financials are then presented as a continuation of the private company’s history. Control is judged by who holds the largest voting bloc, relative size, and who runs the board and management, which is why a structure like this only makes sense when the AI-native founders and shareholders retain control (Part 5). One structural point, and an opportunity. In an IPO, the act of listing is a primary capital raise. A reverse merger is a share exchange and brings no new cash into the business by itself; these deals are therefore paired with a concurrent PIPE (private investment in public equity) that closes alongside the merger. For an AI-native scaler, that PIPE is the moment to raise growth capital at the point of listing, from public-market and crossover investors with appetite for AI-native category leaders. The capital funds integration and accelerates the combined flywheel. It can be a deeper pool than the next private round and, if the combined entity re-rates to a public multiple, a less dilutive one, though PIPEs do price at a modest discount to market (~6% on average, sometimes with warrants).
Precedents, adjacent, not identical. The structure is well-worn:
| Precedent pattern | Examples | What it proves |
|---|---|---|
| Strategic operating reverse mergers | T-Mobile / MetroPCS (2013); Berkshire Hathaway; Burger King via Justice Holdings (2012); Turner Broadcasting / CNN; Option Care / BioScrip (2019) | A private or controlled operating company can use a public operating company to gain a listing and acquire strategic assets while retaining control. Option Care / BioScrip is the clean healthcare example: Option Care’s backers kept roughly 80% of the combined company and the public listing. |
| Recent AI/tech listings via reverse merger or SPAC (2025-26) | PlusAI (autonomous trucking, Churchill Capital); Infleqtion (quantum, NYSE: INFQ); MobileWalla (agentic AI, via SPACSphere); Core AI Holdings (Nasdaq: CHAI) | AI and frontier-tech companies are still using alternative public-market paths when timing, liquidity, or category momentum matter more than waiting for a traditional IPO. |
| AI-native + distribution roll-ups in healthcare | Commure/Athelas + Augmedix + Memora Health; Prosper AI + Firstsource | Healthcare AI companies are already pairing AI products with distribution. Commure/Athelas did it by acquiring the public scribe company Augmedix; Prosper AI did it through a revenue-cycle distribution partner. |
On novelty. A private AI-native company reverse-merging a healthy, profitable public distribution incumbent, rather than a shell, a SPAC, or a services roll-up, is rare in recent years; most recent AI listings chose a traditional IPO or a SPAC. Capital markets evolve constantly, and the present moment is unusual on both axes: the pace of technological change and the scale of capital-market movement (a record IPO year, trillion-dollar AI listings). Structures that look unconventional in one cycle can become ordinary in the next; sometimes it pays to think different. The standard mechanics still apply. Reverse mergers carry inherited-liability, liquidity, and compliance considerations and raise no capital on their own, things to engineer around rather than verdicts. This section is the factual how and when, alongside the why of Parts 1-6; none of it is a recommendation.
Part 8: precedent. Strategic M&A unlocking value from out-of-favor public companies
The thesis in Parts 1-6 isn’t hypothetical. Buyers have repeatedly turned mispriced or out-of-favor public companies into large gains: by operating and re-selling, by combining them with a strategic asset, or by paying up for embedded distribution. Grouped by deal type, with the counter-example that keeps it honest. (Illustrative precedents, not investment advice.)
Type 1: take private, re-rate, sell to a strategic. A profitable but unloved public company is taken private cheaply, improved, and resold, often to a strategic that needs the asset, for a multiple within a few years.
| Deal | Sponsor → strategic exit | Entry | Exit | Result |
|---|---|---|---|---|
| athenahealth (health-IT) | Veritas/Elliott → Bain + Hellman & Friedman | $5.7B (2019) | $17B (2022) | ~3x in ~3 yrs |
| Ellie Mae (mortgage SaaS) | Thoma Bravo → Intercontinental Exchange | $3.7B (2019) | $11B (2020) | ~3x in ~15 mo |
| Marketo (martech SaaS) | Vista → Adobe | $1.79B (2016) | $4.75B (2018) | ~2.6x; ~$3B gain |
Type 2: take private, build it up, relist larger. Use the private window to combine the incumbent with a strategic asset, or simply scale it, then return to public markets at a higher multiple. The value cousin of the reverse merger in Part 7.
| Deal | Buyer | Entry | What they did | Outcome |
|---|---|---|---|---|
| Dell | Silver Lake + M. Dell | $24B (2013) | Acquired EMC / VMware ($67B, 2016) | Relisted 2018 at a far higher EV |
| Ceridian → Dayforce | Thomas H. Lee + partners | $5.3B (2007) | Built a cloud product on the payroll base | Re-IPO 2018; processor → cloud multiple |
| Cvent (event-tech SaaS) | Vista Equity | $1.65B (2016) | Scaled organically and via bolt-ons | Relisted at ~$5.3B (2021), ~3x entry |
Cvent’s re-rating came mainly from growth and the 2021 market window, apart from any strategic-asset combination; it later went private again with Blackstone at $4.6B in 2023.
Type 3: a strategic pays a premium for embedded distribution. The unglamorous workflow rails are worth more inside an acquirer’s platform than to public shareholders pricing a mature service business.
| Deal | Acquirer | Value | What was bought |
|---|---|---|---|
| Black Knight | Intercontinental Exchange | $11.9B (2023) | Mortgage workflow rails (after Ellie Mae) |
| R1 RCM | TowerBrook + CD&R | $8.9B (2024) | RCM embedded in 500+ systems, $1T+ revenue |
Type 4: the counter-example. A rich multiple plus weak integration destroys value as fast as good deals create it; the re-rating has to be earned.
| Deal | Structure | Value | Outcome |
|---|---|---|---|
| Teladoc-Livongo | All-stock merger (2020) | $18.5B | ~$13.4B goodwill written off by 2022 |
Two things to hold onto. The winners above are survivors: plenty of take-privates underperform, and a cheap incumbent is sometimes cheap for a reason; the discipline is telling a durable, out-of-favor asset (real distribution, sticky revenue, positive cash flow) from a declining one, which is the question Parts 1-3 put to Phreesia. And these deals cluster where capital bifurcates: when the market crowds into a new narrative (dot-com, cloud, now AI), it bids up the story names and compresses incumbents’ multiples, widening the exact gap these buyers exploit. AI-native patient-access companies raising at 40-100x revenue while a profitable distribution incumbent trades near 1.3x is that same dislocation in a new decade.
Synthesis
- The base’s public price is explicable by its own cash flows (~$683M EV ≈ a conservative net-FCF DCF), so the thesis holds without the market being wrong; this is about strategic fit, apart from any claim of mispricing. Intrinsic value (product moats, competitive durability) is a deeper question this piece doesn’t try to settle.
- Two assets are hard to build and slow to rush: the ~4,700-org distribution (even the incumbent adds only ~300/yr, so ~7-16 years organically) and the $4B embedded payments rails (deeply sticky and data-rich, with AccessOne’s financing the hardest piece to recreate).
- The combination’s edge is time and reach, delivered through an upgrade-in-place channel that is additive, plus the embedded payments surface and a back-door public listing.
- An AI-native scaler can build and buy at once. The decision reduces to whether the combined entity is worth materially more than the ~$1.9B sum of standalones. The long-run driver is execution: the combination accelerates the AI-native scaler’s growth flywheel (instant distribution, the payments surface, ~180M visits of data), and the market re-rates the combined business as that proves out. A credible 4-5x revenue multiple on ~$600M implies ~$2.4-3.0B (a sensible ~16-20x EV/EBITDA), the “1 + 1 > 3” outcome (Part 5a). So the direction is plausibly positive; the magnitude hinges on executing the flywheel, and on whether the scaler’s product edge is durable enough to make the combination compelling in a large, growing market (Part 5b).
- Timing is the real argument. With the raw model layer commoditizing, the durable moat is a strong product plus the distribution, data, and embedded workflow around it, and building that reach is a race. Building reach the way Phreesia did, logo by logo, is slow (Parts 2-3), though portfolio-wide or health-system channels can move faster; incumbents can rent frontier capability onto bases they already own; and well-funded entrants are chasing the same customers. The cost of standing still is the quiet risk (Part 6). And the how and when line up with the why: the public-market window is open now, and a strategic reverse merger offers a faster, window-independent path to a listing and distribution in one move (Part 7).
- There is precedent for the value unlock. Strategic and private-equity buyers have repeatedly re-rated out-of-favor public companies, by operating and re-selling, by combining them with a strategic asset, or by paying up for embedded distribution, though the winners are survivors and the re-rating has to be earned (Part 8).
Caveats. Illustrative throughout. The swing variables are the re-rate multiple, the synergy magnitude, the exchange ratio, churn, and integration execution; the sourced anchors (pace ~300/yr, payments $4B, retention ~99%, FCF ~$70M) are solid, the modeled figures are directional. CLTV is a gross-profit pool, not an EV. Not investment advice.
Appendix: inputs and assumptions (and how solid each is)
| Input | Value | Confidence / source |
|---|---|---|
| Phreesia organizations (AHSCs) | ~4,708 | Hard: PHR Q1 FY27 deck |
| Phreesia net org adds / year | ~300 (4,411→4,708 over four quarters) | Hard: PHR AHSC series |
| Direct provider ACV (sub + payments) | ~$75.5k | Hard: PHR segments ÷ AHSCs |
| Company gross margin / FCF | ~68% / ~$70M | Hard: PHR FY26 |
| Client (logo) retention | ~99% | Hard: PHR Q1 FY27 transcript |
| Patient-payment volume | >$4B / yr (payments ~26% of revenue) | Hard: PHR disclosures |
| AI-native scaler scale (illustrative) | fast-growing voice-native patient-access company; low-tens-of-$M revenue today, growing toward an illustrative ~$90M by a combination horizon | Illustrative |
| Healthcare sales cycle | 9-18 mo (systems); 60-90 days (small practices) | Medium: health-IT GTM benchmarks |
| Legacy CAC per logo | ~$75-150k | Soft: cross-sector SaaS, nudged for healthcare |
| AI-native CAC per logo | ~$40-70k | Hypothesis: directional only; conclusions do not hinge on it |
| Discount rate / churn | 20% / 10% | Assumption: deliberately harsh (vs. ~99% retention) to absorb disruption risk |
The conclusions rest on the sourced anchors, the incumbent’s ~300-net-orgs/year pace and the $4B embedded payments moat, apart from the soft CAC figures. Whether a new entrant’s CAC is $55k or $125k changes the dollar total but barely moves the years: the binding constraint is the sales-and-implementation clock, not the marketing budget.
Sources
- PHR Q1 FY27 deck (AHSCs, segments, margins, pace): https://s24.q4cdn.com/837435241/files/doc_financials/2027/q1/Q1-FY27-IR-Presentation.pdf
- PHR Q1 FY27 transcript (99% retention): https://www.fool.com/earnings/call-transcripts/2026/05/27/phreesia-phr-q1-2027-earnings-transcript/
- PHR patient-payment volume (>$4B): https://ir.phreesia.com/ (FY25-26 results)
- Embedded-payments switching costs: https://www.patientpay.com/blog/why-embedded-payments-isnt-always-the-right-answer-in-healthcare · https://www.rectanglehealth.com/resources/blogs/embedded-vs-standalone-healthcare-payment-solutions/
- Healthcare sales-cycle: https://healthlaunchpad.com/why-selling-to-healthcare-takes-so-long/
- SaaS CAC / quota / efficiency benchmarks (legacy-CAC range): Scale VP · First Page Sage / Pavilion · Bridge Group 2024 SaaS AE metrics
- PHR valuation/FCF/guide: see
research-notes.mdfor full receipts - Distribution vs. innovation (Alex Rampell, a16z, the “distribution before the incumbent gets innovation” line): https://a16z.com/distribution-vs-innovation/ (orig. 2015)
- Agentic AI, startups vs. incumbents (HBR, Jul 2026): https://hbr.org/2026/07/how-agentic-ai-supercharges-startups-and-threatens-incumbents
- AI infrastructure-vs-application revenue gap / excess funding (Sequoia, David Cahn, “$600B question”): https://www.sequoiacap.com/article/ais-600b-question/
Part 7: market window & reverse mergers
- 2026 IPO window / market (largest-on-record framing): https://news.crunchbase.com/public/crunchbase-predicts-15-companies-ipo-ai-fintech-defense-forecast-2026/ · https://builtin.com/articles/top-tech-ipos-2026
- SpaceX IPO (Jun 12, 2026; largest in history): https://www.cnbc.com/2026/05/20/spacex-ipo-live-updates.html
- Anthropic / OpenAI confidential IPO filings (Jun 2026): https://techcrunch.com/2026/06/08/following-anthropic-openai-files-confidentially-for-ipo/ · https://www.cnbc.com/2026/06/08/openai-confidentially-files-for-ipo-prepping-wall-street-for-ai-debut.html
- Reverse takeover / reverse-merger mechanics & speed: https://en.wikipedia.org/wiki/Reverse_takeover · https://www.cbiz.com/insights/article/understanding-reverse-mergers-a-faster-path-to-the-public-markets
- Reverse-acquisition accounting (private = accounting acquirer; ASC 805 / IFRS 3): https://viewpoint.pwc.com/dt/us/en/pwc/accounting_guides/business_combination/business_combination__28_US/chapter_2_acquisitio_US/210_reverse_acquisit_US.html · https://www.grantthornton.global/en/insights/articles/ifrs-3-insights/ifrs-3-reverse-acquisitions-explained/
- T-Mobile / MetroPCS reverse takeover (2013): https://en.wikipedia.org/wiki/T-Mobile_US
- Recent AI/tech via reverse merger / SPAC: PlusAI-Churchill (https://www.freightwaves.com/news/plusai-spac-merger-2026) · Infleqtion (NYSE: INFQ) · MobileWalla-SPACSphere (NASDAQ: SSAC) · Core AI Holdings (Nasdaq: CHAI)
- Healthcare AI + distribution roll-ups: Commure-Augmedix (https://www.fiercehealthcare.com/ai-and-machine-learning/augmedix-acquired-commure-valuation-139-mil) · Commure-Athelas (https://www.fiercehealthcare.com/health-tech/health-tech-companies-commure-athelas-unveil-merger-plans-drive-automation-llm-tech)
- PIPE economics (~6% avg discount to market, warrants): https://corpgov.law.harvard.edu/2017/11/16/the-economics-of-pipes/
- IPO stage/age norms (median age ~12-14 yrs, ~$218M revenue; staying private longer, Jay Ritter / Univ. of Florida): https://www.cnbc.com/2025/10/07/ipo-market-startups-staying-private-longer-alternative-capital.html
Part 8: value-unlock precedents
- athenahealth ($5.7B 2019 → $17B 2022): https://www.baincapital.com/news/athenahealth-healthcare-technology-leader-be-acquired-hellman-friedman-and-bain-capital-17 · https://www.healthcaredive.com/news/bain-hellman-friedman-leveraged-buyout-ehr-athenahealth-17-billion/610433/
- Ellie Mae → ICE ($3.7B 2019 → $11B 2020): https://www.housingwire.com/articles/intercontinental-exchange-to-acquire-ellie-mae-from-thoma-bravo-for-11-billion/
- Bending Spoons IPO / public valuation and acquisition strategy: https://www.businesswire.com/news/home/20260630780689/en/Bending-Spoons-S.p.A.-announces-pricing-of-initial-public-offering · https://www.investing.com/equities/bending-spoons-s-p-a · https://simplywall.st/stocks/us/software/nasdaq-bsp/bending-spoons/valuation · https://www.businesswire.com/news/home/20251029086811/en/Bending-Spoons-to-acquire-AOL-following-%242.8B-debt-financing · https://vimeo.com/press/media-release/vimeo-enters-definitive-agreement-be-acquired-bending-spoons-138 · https://www.businesswire.com/news/home/20251202408560/en/Eventbrite-Enters-into-Definitive-Agreement-to-Be-Acquired-by-Bending-Spoons-for-Roughly-%24500-Million-to-Accelerate-Eventbrites-Next-Phase-of-Growth
- Marketo → Adobe ($1.79B 2016 → $4.75B 2018; Vista ~$3B gain): https://www.cnbc.com/2018/09/20/adobe-confirms-its-buying-marketo-for-4point75-billion.html · https://www.forbes.com/sites/nathanvardi/2018/09/21/billionaire-robert-smiths-vista-equity-makes-3-billion-selling-marketo/
- Dell take-private / EMC-VMware / 2018 relist: https://techcrunch.com/2016/09/07/67-billion-dell-emc-deal-becomes-official-today/ · https://fortune.com/2018/12/11/dell-technologies-founder-michael-dell-wins-vote-to-relist-computer-and-software-company-on-nyse/
- Ceridian → Dayforce ($5.3B take-private 2007; re-IPO 2018): https://mergr.com/fidelity-national-financial-acquires-ceridian-hcm-holding · https://www.bloomberg.com/news/articles/2018-04-25/thomas-h-lee-backed-ceridian-raises-462-million-in-u-s-ipo
- Cvent (Vista $1.65B 2016 → SPAC ~$5.3B 2021 → Blackstone $4.6B 2023): https://techcrunch.com/2023/03/14/cvent-to-go-private-again-in-4-6b-blackstone-deal/
- ICE-Black Knight ($11.9B 2023): https://www.businesswire.com/news/home/20230905668146/en/Intercontinental-Exchange-Completes-Acquisition-of-Black-Knight-and-Announces-Preliminary-Results-of-Elections-Made-by-Black-Knight-Stockholders-in-Connection-with-the-Acquisition
- R1 RCM take-private ($8.9B 2024): https://www.globenewswire.com/news-release/2024/08/01/2922679/0/en/R1-RCM-to-be-Acquired-by-TowerBrook-and-CD-R-for-8-9-Billion.html
- Teladoc-Livongo ($18.5B 2020; ~$13.4B impairment 2022): https://ir.teladochealth.com/news-and-events/investor-news/press-release-details/2020/Teladoc-Health-and-Livongo-Merge-to-Create-New-Standard-in-Global-Healthcare-Delivery-Access-and-Experience/default.aspx · https://www.healthcaredive.com/news/teladoc-historic-net-loss-137b-2022/643213/
- Option Care / BioScrip reverse merger (2019; Part 7): https://investors.optioncarehealth.com/news-releases/news-release-details/bioscrip-announces-shareholder-approval-merger-option-care
Not investment advice. Illustrative model for strategic discussion.
Footnotes
-
Phreesia faces a routine post-stock-drop securities suit (the kind many public companies see after a guide-down); such suits are frequently dismissed and are noted here only as a minor, standard overhang, not a thesis risk. ↩
-
CLTV (gross-profit basis) is a growing perpetuity: annual gross profit × (1 + expansion) ÷ (discount rate + churn − expansion). Inputs: ~10% gross churn (a 10-year average life, deliberately well above Phreesia’s ~1% actual churn / ~99% retention, to build in technology-disruption risk) netted against ~3% annual expansion, i.e. net revenue retention ≈ 93%. Network/pharma revenue is included here at the blended margin but is more cyclical than subscription/payments, so the conservative churn and discount rates do double duty. ↩
-
The ~$125k legacy CAC triangulates three ways, all landing in a $75-150k zone. First, SaaS sales-efficiency: magic number ~0.7 → ~$113-151k of S&M per $75.5k of first-year direct ACV. Second, rep-capacity: ~$400-480k loaded cost per rep ÷ ~5-8 healthcare logos/yr ≈ $75-120k. Third, Phreesia’s own revealed cost: ~$628M cumulative S&M ÷ 4,700 clients ≈ $134k, an upper bound, since most of that S&M defends and expands the base rather than wins new logos. The ~$55k AI-native CAC is a hypothesis, not a benchmark: the number most worth pressure-testing, and if AI-native GTM is only modestly cheaper, the build collapses toward the legacy figures. ↩