What is generative AI clinical intelligence worth for clinical-trial recruitment?
A data-grounded estimate of what an ambient clinical intelligence layer is worth when it helps multi-site trials find, qualify, and fill candidates. Built from real ClinicalTrials.gov volume and sourced unit economics.
How to read this. This is an illustrative framework, not a forecast or a vendor quote. The trial volume is real; the unit economics are benchmark assumptions; the improvement and capture assumptions are conservative and clearly labeled. Every figure is an input you can change. What matters here is the structure and the math, not precision.
Patient recruitment is the single most reliable reason a clinical trial goes over time and over budget. Roughly 80% of trials miss their original enrollment timelines, more than half finish enrollment late, and about 13% of North American sites enroll zero patients while up to half enroll one or none (Applied Clinical Trials; recruitment review). Every slipped month costs money. Every wasted screen is money spent to not enroll a patient.
Ambient clinical intelligence is the structured signal captured from the patient-clinician conversation at the point of care. Most write-ups treat it as a documentation tool. It also does a second job: it helps trials find, qualify, and fill candidates by surfacing likely eligible patients in routine care and pre-qualifying them before a site visit.
This piece answers one narrow question. How much is that worth?
The approach
Derive a market size instead of asserting one: real trial volume x sourced unit economics x a conservative improvement assumption. Then credit ambient AI with the improvement delta alone, holding it to the marginal savings rather than the full cost of recruiting a patient.
Step 1: the volume
From AACT, a daily mirror of ClinicalTrials.gov, the set of active US-site Phase 2/3 industry drug trials that are currently enrolling for 17 major pharma sponsors looks like this:
| Cohort metric | Value |
|---|---|
| Enrolling trials, recruiting / not yet / by invitation | 676 |
| Target enrollment, US-only trials | 28,981 |
| Target enrollment, multinational trials, global | 441,105 |
| US trial sites | 22,898 |
| US-attributable participants, at 35% multinational US share | ~183,000 |
Ambient AI works where patients are seen in US care, so the base that matters is US-attributable participants rather than the global enrollment figure. This 17-sponsor cohort is a lower bound on the whole industry.
Step 2: the unit economics
| Input | Base | Source / note |
|---|---|---|
| Recruitment cost per enrolled participant | $6,500 | mdgroup cites approximately $6,533 |
| Baseline screen-fail rate | 40% | Industry range is roughly 30-50% |
| Cost per failed screen | $2,000 | Screen-fail cost can exceed $1,200; higher with sponsor and diagnostic load |
| Trial operating cost per day, Phase 3 | $40,000 | Tufts CSDD |
| Lost sales per delay day | $800,000 | Tufts CSDD average; must be risk- and margin-adjusted |
Step 3: the math
The base case assumes a conservative ambient-AI lift: 15% lower recruitment cost per enrolled participant from better point-of-care pre-qualification, plus a 5-point screen-fail reduction, from 40% to 35%.
The value model:
- Avoided failed screens per enrolled participant:
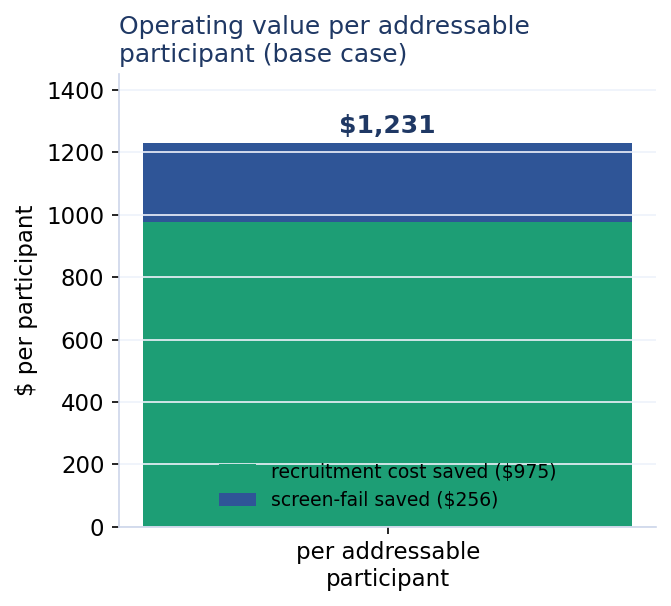
1 / (1 - 0.40) - 1 / (1 - 0.35) = 0.13 - Recruitment cost saved per enrolled participant:
$6,500 x 15% = $975 - Screen-fail cost saved per enrolled participant:
0.13 x $2,000 = $256 - Operating value per participant:
$975 + $256 = $1,231
Spread the US-attributable participants over an approximately two-year recruitment window, then take a 60% addressable-condition fraction, and you get about 55,000 addressable participants per year.
- Operating value to sponsors per year:
~55,000 x $1,231 = ~$68M - Vendor addressable revenue per year for this 17-sponsor cohort:
$68M x 12% capture = ~$8M
Sensitivity
Two assumptions move the answer most: the US-enrollment share and the recruitment-cost reduction. Across plausible ranges, sponsor operating value runs ~$38M-$117M per year for this cohort.
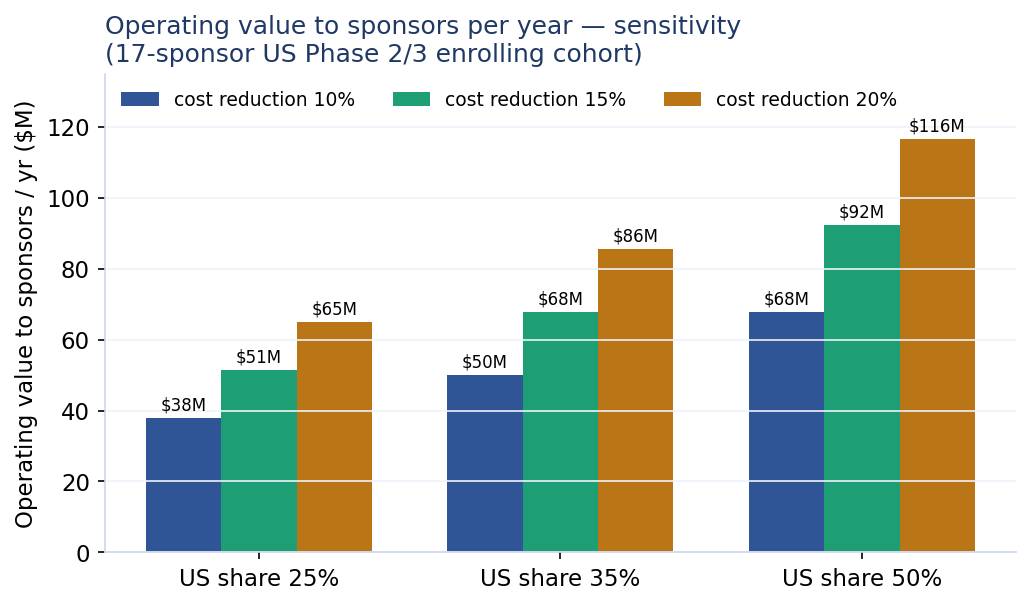
| US share / cost reduction | 10% | 15% | 20% |
|---|---|---|---|
| 25% | $38M | $51M | $65M |
| 35% | $50M | $68M | $86M |
| 50% | $68M | $92M | $117M |
The bigger number is time, and it stays off the books
Cost savings are the defensible value. The larger value comes from acceleration: enrolling faster pulls the whole program forward. Risk- and margin-adjusted, at 45% probability of success and 80% margin, one delay day is worth roughly $40,000 of operating cost plus about $288,000 of strategic value. So about 1.5 months of acceleration is worth roughly $15M on a single pivotal Phase 3 trial.
The value model:
- Risk-adjusted value per delay day:
$40,000 + ($800,000 x 45% x 80%) = $328,000 - Strategic value per accelerated trial:
(1.5 x 30.4 days) x $328,000 = ~$15M
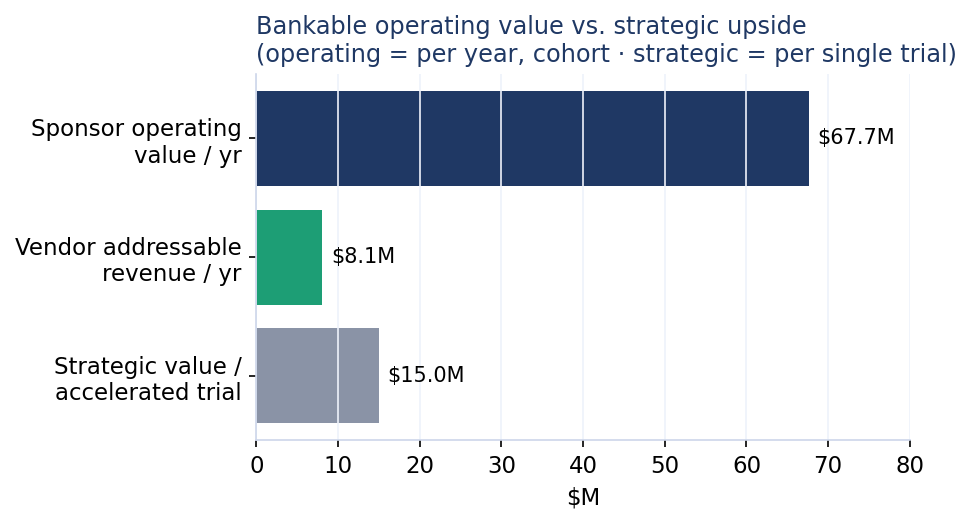
Multiply that per-trial figure across the cohort and the theoretical number gets very large. It stays a ceiling. Acceleration is shared across many inputs: protocol, sites, payers, patient availability, and ambient signal. Attribution to any one layer is partial and assumption-heavy.
Cost efficiency is bankable and moderate. Time value is large, and it belongs in the strategic column rather than a clean revenue line.
What this says
For just 17 sponsors’ US Phase 2/3 trials, an ambient clinical intelligence recruitment layer plausibly creates tens of millions per year in sponsor operating value, equal to roughly $8M per year of addressable vendor revenue at a modest capture rate, and it scales materially across the full industry.
The strategic, time-based upside is far larger per trial. Argue it; keep it off the ledger. The method carries the weight here. Derive it from real volume, credit the delta alone, keep bankable and strategic apart, and show every assumption. Skip any of those steps and the number stops meaning anything.
Sources and method
Volume comes from AACT / ClinicalTrials.gov as of June 26, 2026. Unit economics come from mdgroup, Tufts CSDD, oncology eligibility-screening cost research (JOP), and the recruitment-performance literature cited above. Figures are illustrative and directional.